# Qianhe Chen
URL: https://www.qianhechen.com/
## Qianhe Chen
URL: https://www.qianhechen.com/
Qianhe Chen is a Tech Lead & Founding Engineer at Thinkverse and an HCI researcher working on data visualization, human-AI collaboration, and AI-powered learning systems.

# Qianhe Chen
Tech Lead & Founding Engineer @ Thinkverse · HCI Researcher
- [ Email](mailto:qianhechen01@gmail.com "Email")
- [ LinkedIn](https://www.linkedin.com/in/qianhechen/ "LinkedIn")
- [ GitHub](https://github.com/chenqianhe "GitHub")
- [ Google Scholar](https://scholar.google.com/citations?user=pwbYRX0AAAAJ "Google Scholar")
- [ ORCID](https://orcid.org/0000-0001-8291-5789 "ORCID")
- [ dblp](https://dblp.org/pid/315/4823.html "dblp")
I’m a **Tech Lead & Founding Engineer at [Thinkverse](https://www.thinkverse.co/)** and an HCI researcher working on **data visualization** and **human–AI collaboration**. I work on full-stack development for AI-powered math learning systems and contribute to the design and maintenance of AI services.
My research spans data visualization, human–computer interaction, and human–AI collaboration. I collaborate with [Dr. Ran Wang](https://sjic.hust.edu.cn/info/1168/8606.htm) at [Huazhong University of Science and Technology (HUST)](https://www.hust.edu.cn/) and am also advised by [Dr. Yong Wang](https://yong-wang.org/index.html) at [Nanyang Technological University (NTU)](https://www.ntu.edu.sg/).
I hold a Bachelor of Engineering in Computer Science and Technology and a Bachelor of Laws from HUST.
## Selected Work
### [AI-powered learning at Thinkverse](https://www.qianhechen.com/industry/thinkverse/)
Tech Lead & Founding Engineer at Thinkverse. My work spans full-stack development and contributions to AI service design and maintenance.
[Role and product context →](https://www.qianhechen.com/industry/thinkverse/)
### [Beyond “Be Socratic”: The Hidden Product Decisions Inside an AI Tutor](https://www.qianhechen.com/blog/beyond-be-socratic-ai-tutor/)
Lessons from building an AI math tutor: defining prompt boundaries, collaborating with curriculum specialists, and making evaluation inspectable.
[Read the article →](https://www.qianhechen.com/blog/beyond-be-socratic-ai-tutor/)
## Highlights
* * *
- Oct 2025 📝 **RecruitScope** was accepted to [ICHEC 2025](https://ichec.icachi.org/25/).
- Jul 2025 📝 **Conch** was accepted to [IEEE VIS 2025](https://ieeevis.org/year/2025/welcome).
- Jul 2024 🎉 A project received a **nomination** for [China Vis 2024](https://chinavis.org/2024/challenge.html).
- Jul 2024 📝 **JobViz** was accepted to [Visual Informatics](https://doi.org/10.1016/j.visinf.2024.07.001).
Earlier highlights
- Aug 2023 🧑💻 Joined [Thinkverse](https://www.thinkverse.co/) as a **Full-Stack Engineer**.
- Jun 2023 🎓 Graduated from Huazhong University of Science and Technology with the **Outstanding Graduate Award**.
- Jul 2022 🧑💻 Joined Tencent PCG Group as a **front-end engineering intern**.
- Apr 2022 📝 **RumorLens** was accepted to [CHI EA '22](https://doi.org/10.1145/3491101.3519712).
- Jul 2020 👾 Certified as a [PaddlePaddle Developer Expert (PPDE)](https://www.paddlepaddle.org.cn/ppdemd?n=/ppdemd/%E9%99%88%E5%8D%83%E9%B9%A4) by Baidu.
## Publications
* * *
- 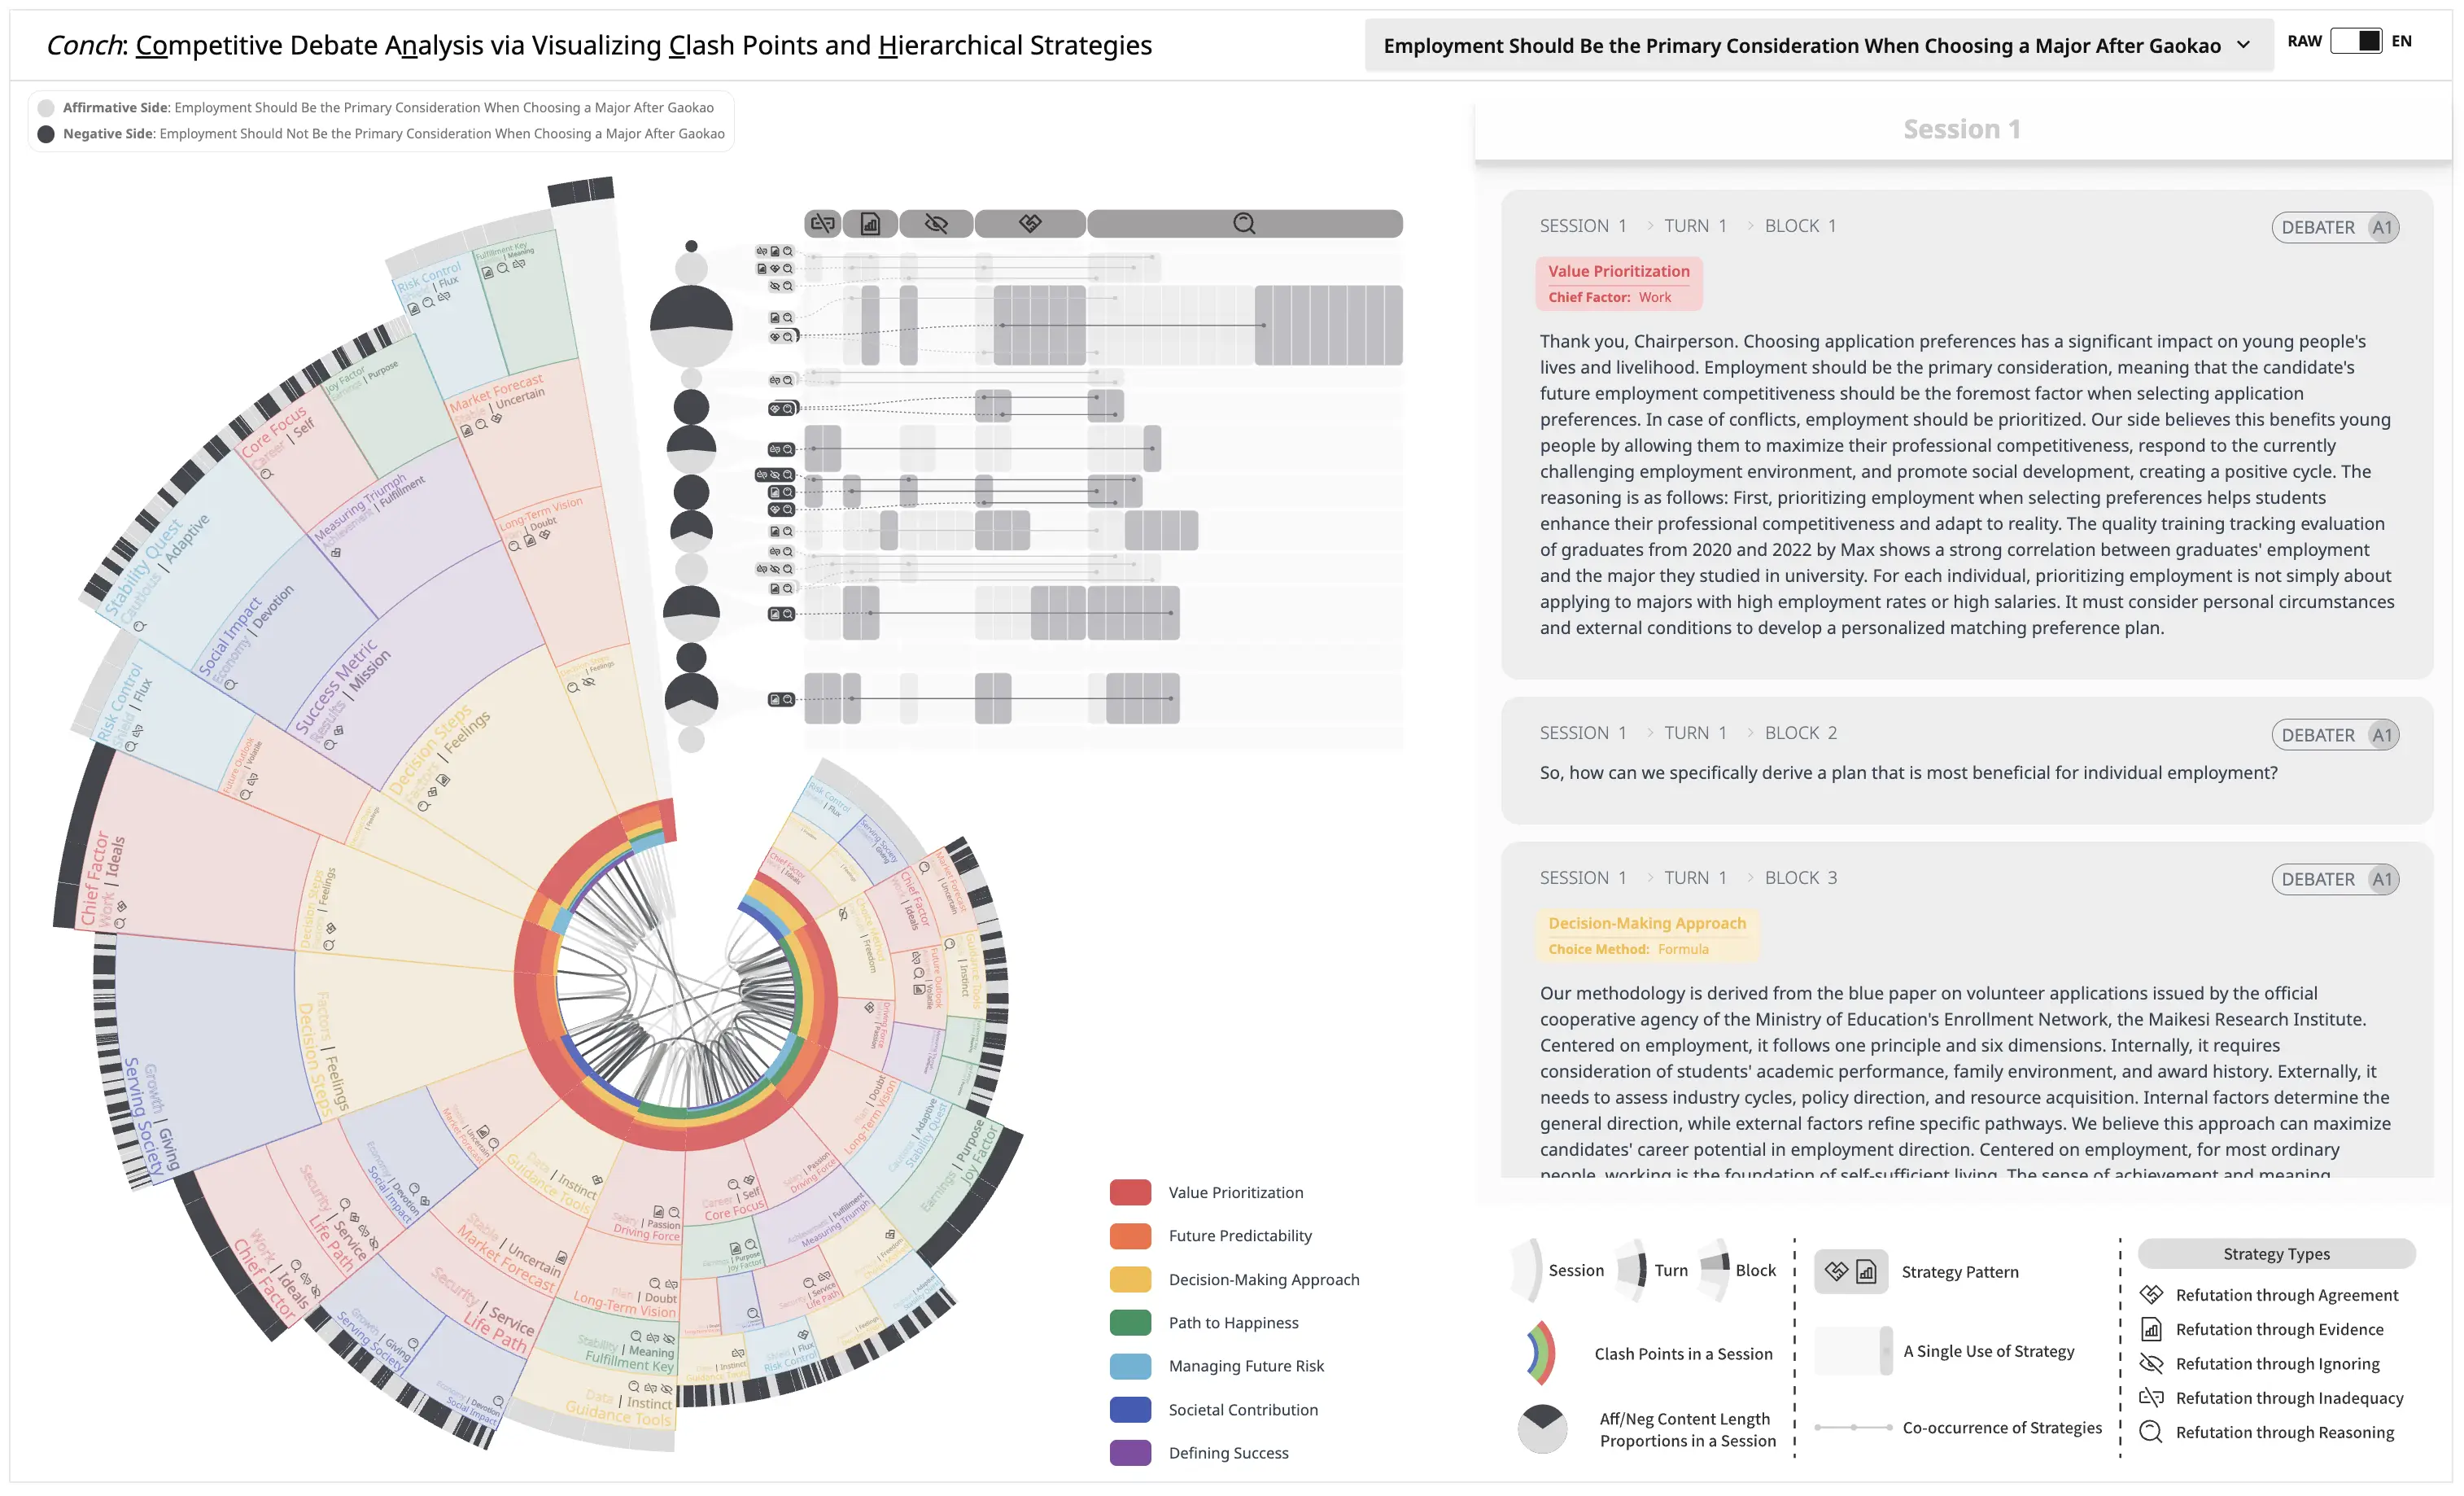
### [Conch: Competitive Debate Analysis via Visualizing Clash Points and Hierarchical Strategies](https://www.qianhechen.com/publications/conch/)
[Qianhe Chen](https://www.qianhechen.com/), [Yong Wang](https://yong-wang.org/index.html), Yixin Yu, Xiyuan Zhu, and Ran Wang\*.
IEEE Transactions on Visualization and Computer Graphics (Proceedings of IEEE VIS 25). 2025.
\[[Paper](https://doi.org/10.1109/tvcg.2025.3634629)\]\[[Page](https://debate.datavizu.app/)\]\[[Arxiv](https://arxiv.org/abs/2507.14482)\]\[[Video](https://youtu.be/kTC33Ta6W2A)\]
- 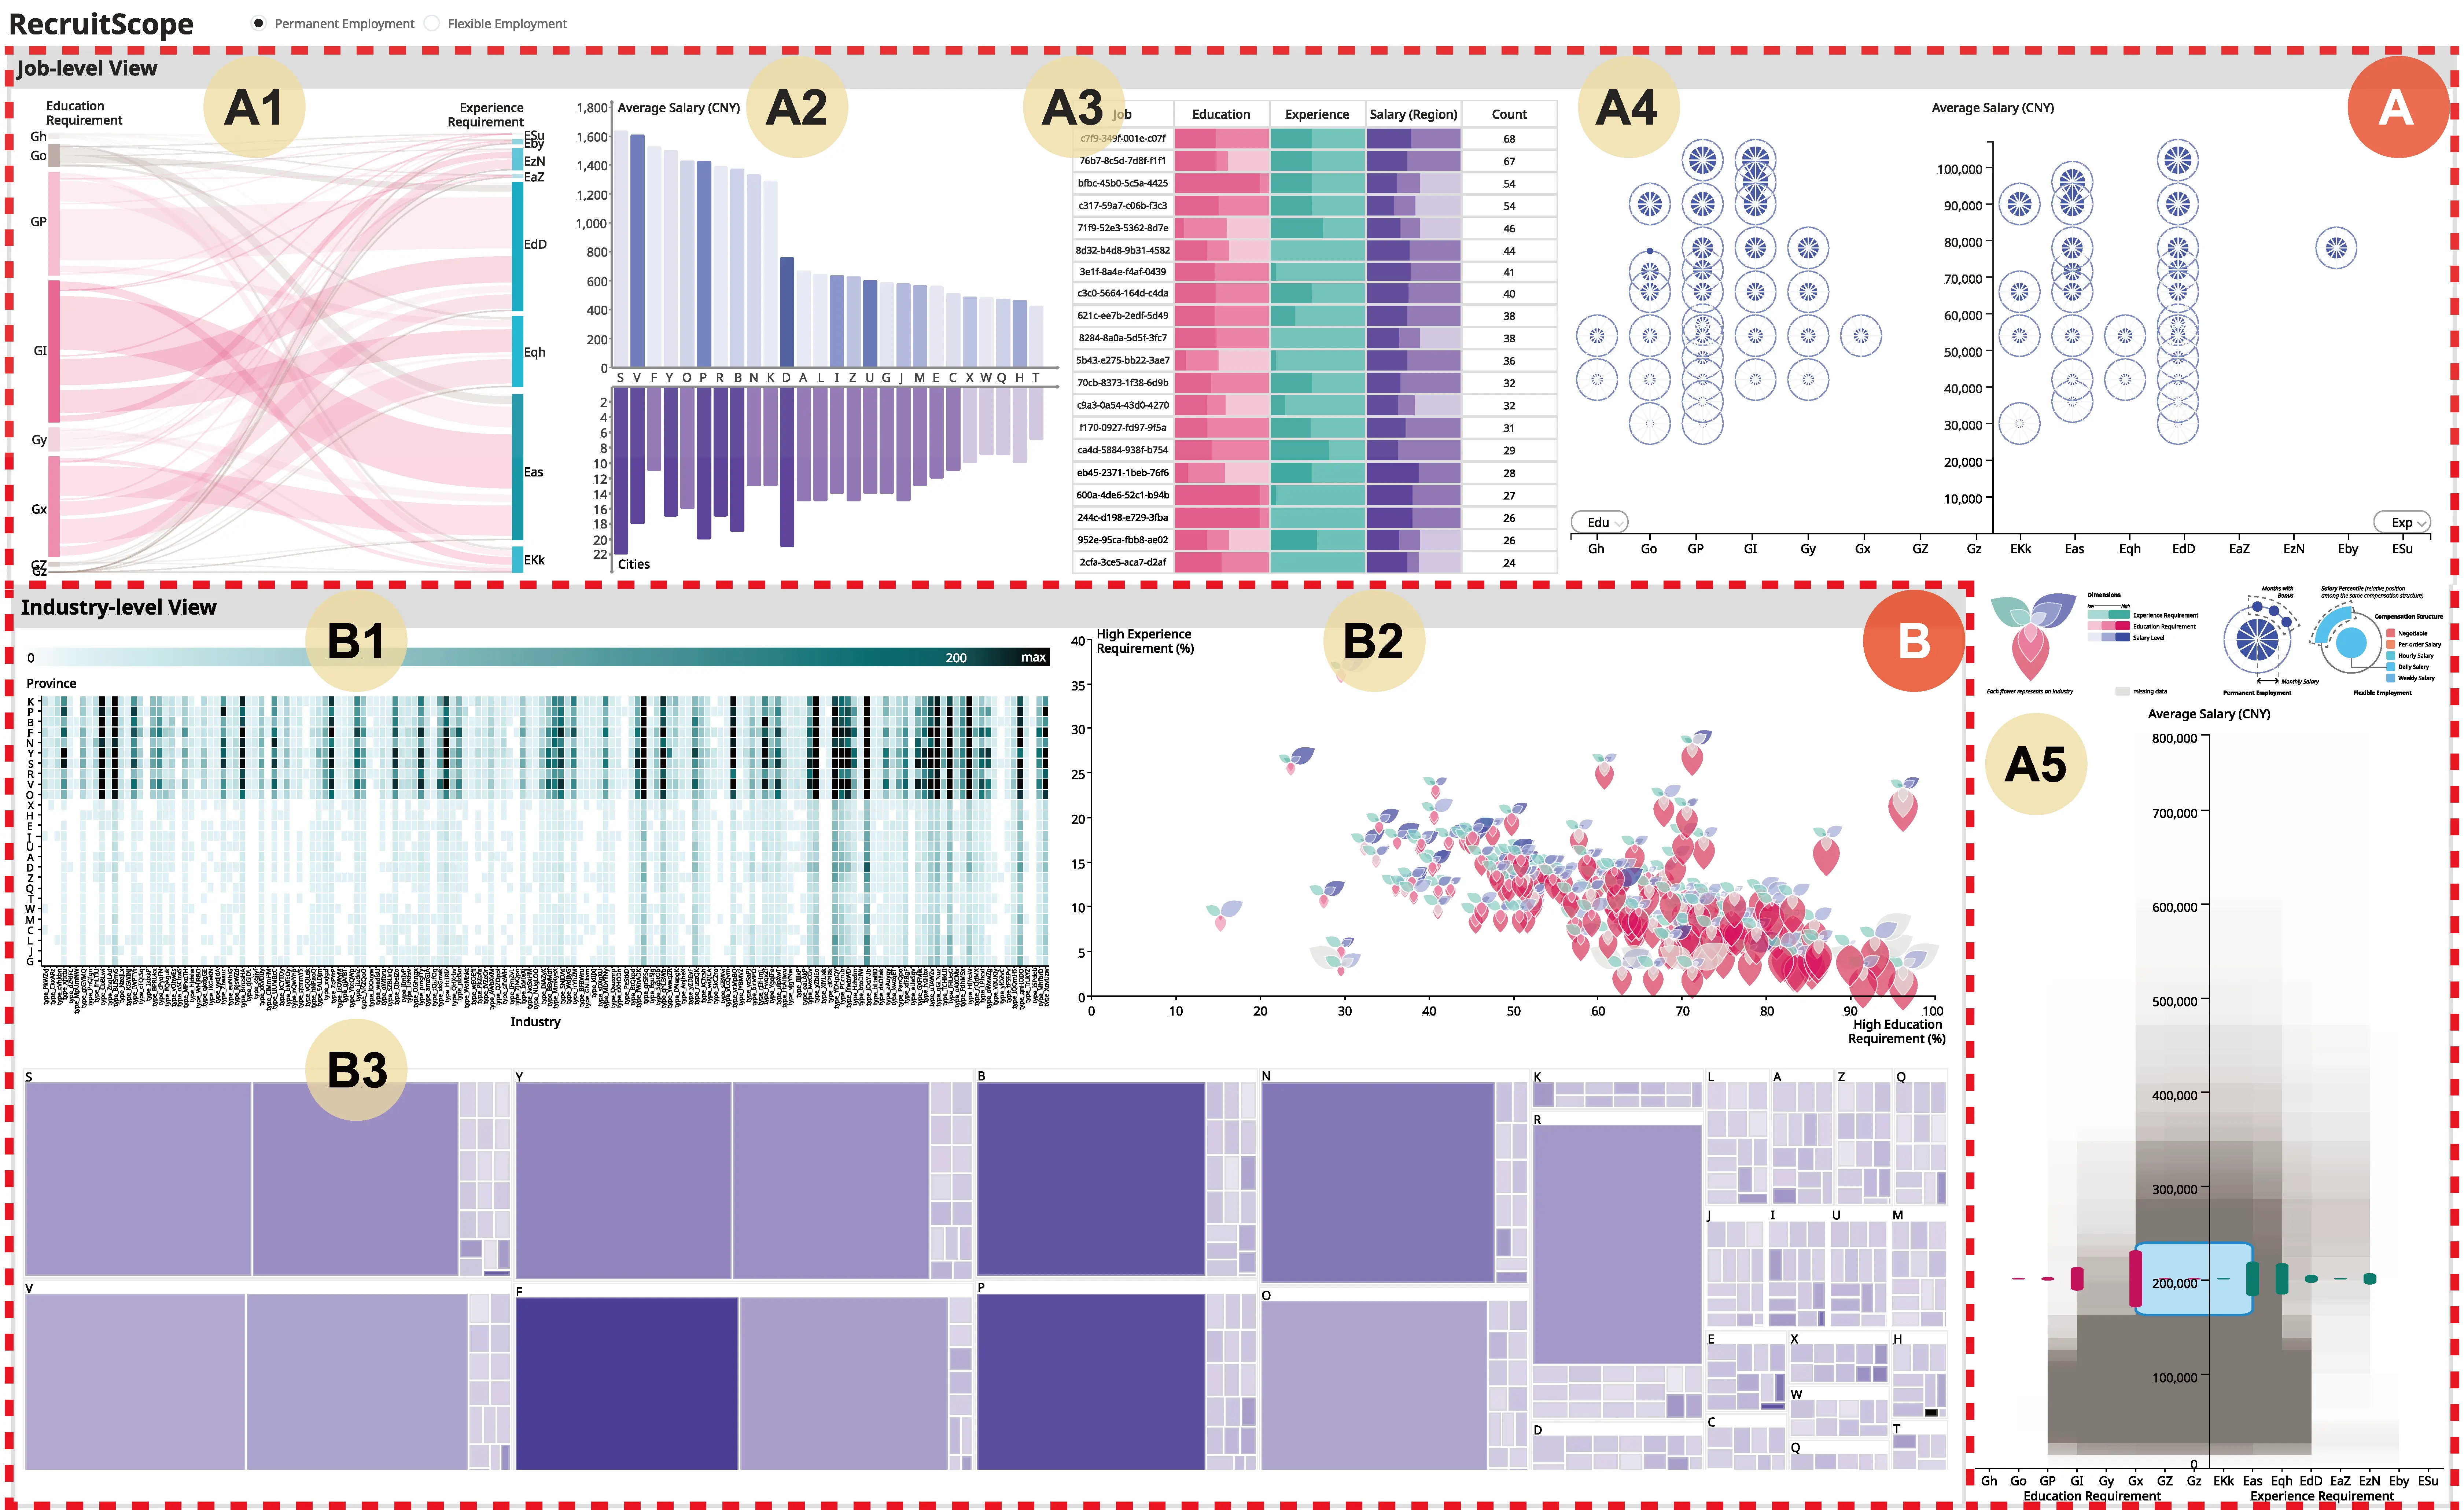
### [RecruitScope: A Visual Analytics System for Multidimensional Recruitment Data Analysis](https://www.qianhechen.com/publications/recruitscope/)
Xiyuan Zhu, Wenhan Lyu, Chaochao Fu, Yilin Wang, Jie Zheng, Qiyue Tan, [Qianhe Chen](https://www.qianhechen.com/), Yixin Yu, and Ran Wang\*.
International Conference on Human-Engaged Computing (ICHEC 2025).
\[[Paper](https://dl.acm.org/doi/10.1145/3786995.3787063)\]\[[Arxiv](https://arxiv.org/abs/2601.04630)\]
- 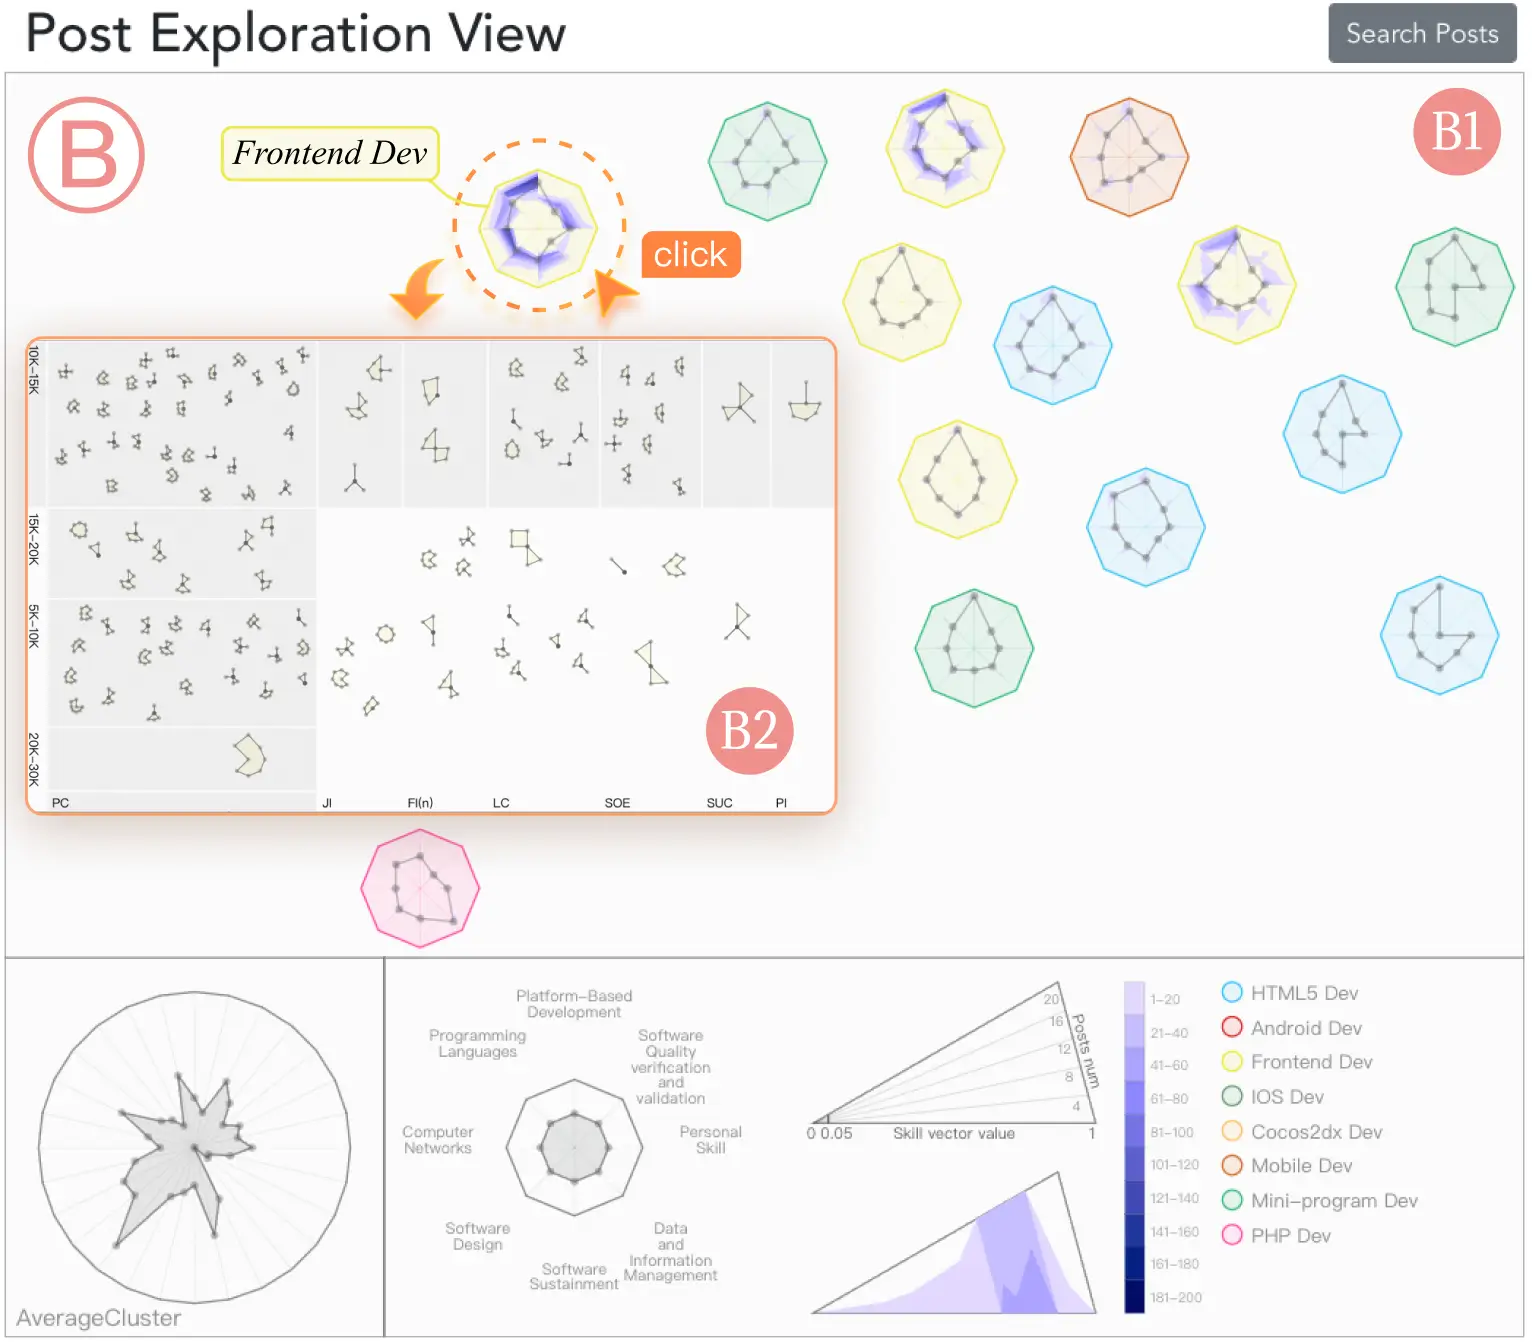
### [JobViz: Skill-driven visual exploration of job advertisements](https://www.qianhechen.com/publications/jobviz/)
Ran Wang, [Qianhe Chen](https://www.qianhechen.com/), [Yong Wang](https://yong-wang.org/index.html)\*, Lewei Xiong, and Boyang Shen.
Visual Informatics. Volume 8, Issue 3, September 2024, Pages 18-28.
\[[Paper](https://doi.org/10.1016/j.visinf.2024.07.001)\]\[[Project](https://jobviz.datavizu.app/)\]\[[GitHub](https://github.com/DataVizU/augmented-radar-chart)\]
- 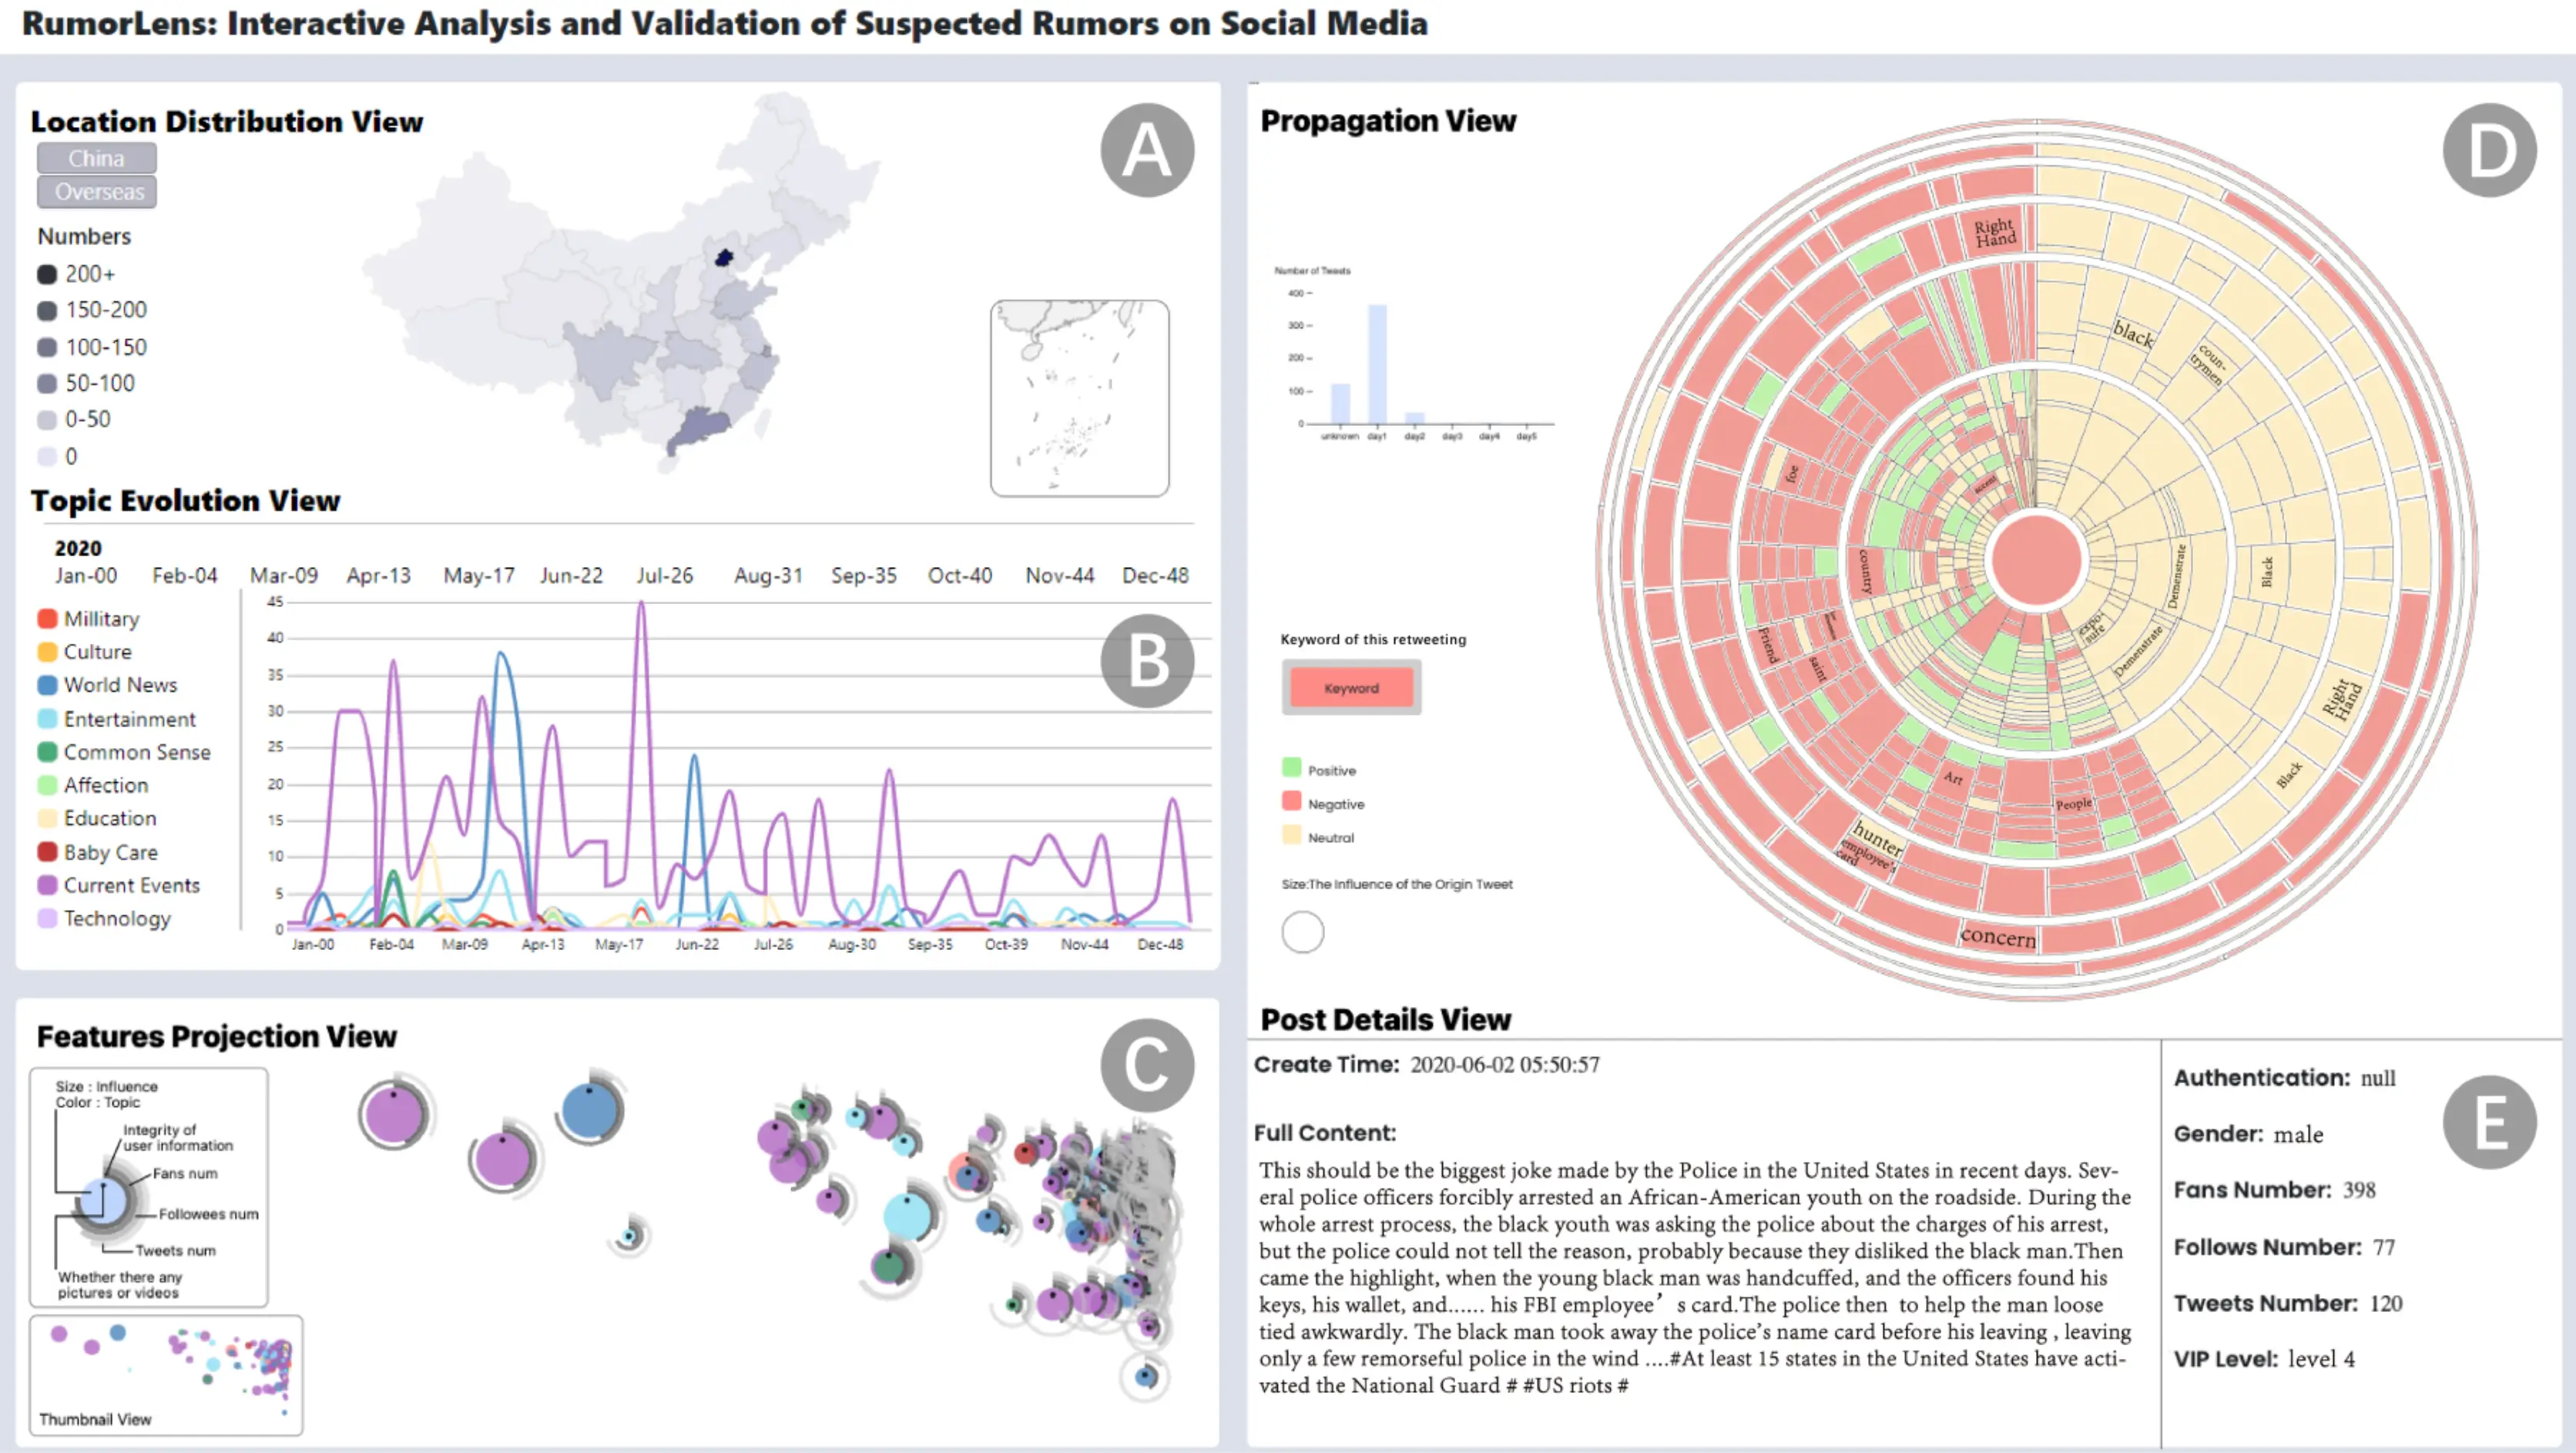
### [RumorLens: Interactive Analysis and Validation of Suspected Rumors on Social Media](https://www.qianhechen.com/publications/rumorlens/)
Ran Wang, Kehan Du, [Qianhe Chen](https://www.qianhechen.com/), Yifei Zhao, Mojie Tang, Hongxi Tao, Shipan Wang, Yiyao Li, and [Yong Wang](https://yong-wang.org/index.html)\*.
CHI EA '22: CHI Conference on Human Factors in Computing Systems Extended Abstracts.
\[[Paper](https://doi.org/10.1145/3491101.3519712)\]\[[Arxiv](https://arxiv.org/abs/2203.03098)\]\[[Project](https://rumorlens.datavizu.app/)\]\[[GitHub](https://github.com/DataVizU/RumorLens)\]
## Open Source Contributions
* * *
- ### [oMLX](https://github.com/jundot/omlx)
An LLM inference server for Apple Silicon. My contributions focus on inference optimization and software improvements.
Earlier contributions (4)
- ### [whisper.cpp](https://github.com/ggerganov/whisper.cpp)
A C/C++ port of OpenAI’s Whisper model. My contributions include cross-platform support and Apple Neural Engine (ANE) optimization.
- ### [Silero VAD](https://github.com/snakers4/silero-vad)
A voice activity detection model. My contributions include algorithm fixes and Node.js bindings.
- ### [AutoCut](https://github.com/mli/autocut)
A tool for editing videos by modifying subtitle files. I am a core contributor and maintainer.
- ### [FastDeploy](https://github.com/PaddlePaddle/FastDeploy)
A toolkit for deploying deep learning models.
## Academic Services
* * *
- ### Conference Reviewer
- IEEE VIS 2025
## Honors and Awards
* * *
- Jun 2023 **Outstanding Graduate Award**, Huazhong University of Science and Technology (HUST).
- Mar 2022 **First-Class Scholarship** awarded by Tencent and School of Computer Science and Technology, HUST.
- Jul 2020 **PaddlePaddle Developer Expert (PPDE)**, certified by Baidu (PPDE ID:20200721008J).
---
## Beyond “Be Socratic”: The Hidden Product Decisions Inside an AI Tutor
URL: https://www.qianhechen.com/blog/beyond-be-socratic-ai-tutor/
Building an AI math tutor means defining who does the reasoning. Lessons from prompt boundaries, curriculum collaboration, and inspectable evaluation.

AI ENGINEERING
# Beyond “Be Socratic”: The Hidden Product Decisions Inside an AI Tutor
Oct 13, 2026 [ai](https://www.qianhechen.com/blog/tags/ai/) [education](https://www.qianhechen.com/blog/tags/education/) [llm](https://www.qianhechen.com/blog/tags/llm/) [evaluation](https://www.qianhechen.com/blog/tags/evaluation/) [software-engineering](https://www.qianhechen.com/blog/tags/software-engineering/)
Building our AI math tutor taught me that the next sentence is a product decision: it determines which reasoning remains the student’s responsibility. Defining that boundary takes prompts, curriculum judgment, and evaluation we can inspect.
An early prototype for our mathematics tutor gave the model an instruction that sounded reasonable in design documents:
> “Guide me through open-ended questions and hints in Socratic method, never revealing answers.”
Supporting notes instructed the model to assess what the student already understood, encourage them to explain their thinking, and focus on one question at a time. It read like solid teaching advice, but it offered no operational rules for how the software should behave across a multi-turn session.
The limits of that instruction surfaced in our test logs. In an internal session, a colleague repeatedly asked our tutor, Pi, for the answer to a geometry problem. Pi responded with the Pythagorean relation: $36+{b}^{2}=100$. When the tester asked again without writing anything, the tutor subtracted 36, wrote ${b}^{2}=64$, and asked: “What number multiplied by itself equals 64?”
The tester marked the interaction as failed. The mathematics was correct, and the model had technically closed the turn with a question. But isolating the variable was the actual exercise. By performing the setup and the subtraction, the tutor reduced a multi-step geometry problem to elementary arithmetic. Without modifying a record in our database or transitioning the client interface, a routine conversational hint had altered the cognitive task assigned to the user.
I work on full-stack development and AI service architecture at Thinkverse, where students ask for help during mathematics practice and show their work on a digital whiteboard. Our founding engineers established the initial prompts; our curriculum colleagues test the tutor and review conversation transcripts. My responsibility is to translate their teaching requirements into software behavior and build the systems that verify it.
Our goal was to leave the reasoning to the student. On each turn, that meant deciding whether a transformation was still theirs to perform, whether they had already demonstrated understanding, or whether a misconception called for a direct explanation.
Those choices become the exact sentence the student sees next. Looking back at these iterations, I have come to view them as core product logic: the model makes some decisions at runtime, and engineering has to define their boundaries.
## How much less help?
One prompt revision I worked on focused on algebraic manipulation. If a student reached $x+18=2x-2$, the tutor was forbidden from simplifying it to $18=x-2$ and asking what to do next. Our system prompt already prohibited supplying reasoning the student had not completed, but that instruction was too abstract to prevent this specific failure. The model routinely carried out the algebraic transformation, handed the simplified expression back to the student, and concluded the turn with an open question.
The difficulty was that the expression $18=x-2$ could not be treated as a forbidden token. If the student had already written $18=x-2$ on the canvas, the tutor needed to reference it freely to validate their progress. Determining whether that mathematical string was acceptable required tracking who had introduced it and identifying the specific skill being practiced. String matching, regex filters, and output guards on the final response could not answer that question.
We had to protect reasoning steps the student had not yet completed and was expected to attempt. The context assembly layer needed to distinguish student contributions from the tutor’s prior outputs. A formula’s presence in the history was not enough; who introduced it mattered.
Multiple-choice questions introduced a similar boundary problem. Because all options were visible on the screen, a tutor could suggest that a student inspect a specific choice without generating any new mathematical formulas. Doing so narrowed the solution space on the student’s behalf. Our prompt instructions had to distinguish between an option being presented as an available choice and an option whose correctness had been confirmed. The tutor had to avoid steering attention toward a specific candidate option while the student was actively deciding, while retaining the ability to validate an option once the student explicitly submitted it.
During code review, our team debated where that rule belonged in our codebase. We decided to split our prompt architecture, moving the restriction into a dedicated template applied only to multiple-choice items. This was a scope decision analogous to placing conditional logic in a specific request handler rather than in a global middleware. A restriction required during open-ended problem solving should not interfere with post-submission answer validation.
Leaving work to the student could not be achieved by piling on negative constraints. If a student had an established misconception, repeatedly asking them what they thought simply prolonged their confusion. Our curriculum rules contained an explicit exception: when the tutor identified a clear misconception, it was permitted to provide a brief conceptual explanation before returning to a guiding question. Giving that concise explanation was an expected part of the teaching strategy.
The digital whiteboard presented another set of conditions. Asking a student to mark a segment or shade an area of a diagram helped when visual relationships were confusing. But if the student had already outlined a sound analytic method in the chat, forcing them to draw on the canvas added friction without improving understanding. Our prompt revisions instructed the tutor to request a concrete visual action when a diagram clarified the problem, and explicitly forbade mandating canvas work when the student was already making progress algebraically.
When curriculum designers asked for hints to be specific without disclosing the next operation, they highlighted this tension directly. When choosing the next algebraic operation is the learning objective, telling the student to subtract 36 is specific, but it performs the task for them. Asking the student to look at the relationship between the two sides of the equation provides support without taking over the step. We had to determine the expected student contribution for that specific turn before deciding how concrete a hint should be. Combining reasonable guidelines in a prompt leaves the reconciliation of those guidelines to the model at runtime.
I understand why teams are drawn to delegating these choices to a language model. Students do not describe their difficulties or approach mathematical problems in uniform ways. Hardcoding every conversational branch into a deterministic state machine would be impractical. A model dynamically composes responses from dialogue history. But relying on that flexibility also delegates the interpretation of the student’s understanding and the choice of appropriate scaffolding.
Our curriculum colleagues help resolve these boundaries against concrete logs. A specialist can explain why a hint undermines an exercise; engineering has to translate that judgment into instructions, runtime state, and validation checks.
I do not decide teaching methodology on behalf of our curriculum team. My job is to understand the requirement we are implementing, including what an earlier failed attempt changes and what counts as evidence of understanding. The same teaching intention leads to different actions depending on the student’s progress:
| Student context | Appropriate assistance | Boundary to protect |
| --- | --- | --- |
| Has not completed the next algebraic step | Guide attention to the relationship between both sides | Do not perform the transformation for them |
| Has already written an intermediate equation | Reference it and validate their progress | Do not treat the equation itself as forbidden |
| Shows a clear misconception | Briefly explain the concept, then return to a guiding question | Do not prolong confusion through repeated questions |
| Is deciding between multiple-choice options | Help them reason without selecting a candidate | Validate a choice after submission, not before |
| Is making progress algebraically | Build on their existing method | Do not require redundant canvas work |
| Answers correctly on the first attempt without help | Acknowledge success and close | Do not require an unsolicited conceptual recap |
## A product decision inside the next sentence
When we tested the revised prompt in an internal preview environment, the results were mixed. The algebra rule held: the tutor stopped simplifying $x+18=2x-2$ on the student’s behalf. But the test case involving repeated demands for the answer failed. The model reverted to the behavior from our opening example, surrendering intermediate equations until only simple arithmetic remained. Out of fourteen targeted checks recorded in that run, eight passed and six failed.
These were targeted preview checks, **not a statistical benchmark of production performance**. We wanted repeated demands for answers to change the form of assistance toward conceptual descriptions or diagrams. Instead, the model made its mathematical hints progressively more specific until it completed the derivation.
Our curriculum team documented similar inconsistencies across iterative retests. In an earlier evaluation round, a curriculum designer on our team examined an exercise on segment midpoints. In the baseline version, the tutor collapsed the geometric reasoning into a bare calculation of $8.5+8.5$. An initial prompt revision appeared to resolve the issue, maintaining guidance over multiple follow-up turns without volunteering the numbers. Yet in a subsequent test round, the same premature arithmetic calculation reappeared.
Because those internal tests were conducted manually by probing the model in a staging environment, we could not isolate the exact cause of the regression. The prompt snapshot, the preceding conversation turns, the phrasing of the tester’s inputs, and the model temperature all introduced variation. Without versioned execution records that tracked the exact system prompt, inputs, and conversation state, we could not determine whether the regression came from model nondeterminism, subtle prompt adjustments, or variations in tester behavior.
This uncertainty highlighted the difference between two separate questions. Had our team clearly defined what assistance was appropriate in that scenario? And had the model complied with that definition? The first question required product and pedagogical judgment; the second required investigating the technical implementation. Incomplete conversational context in our logs often caused those two problems to look identical. Appending more emphatic prohibitions to the end of a system prompt addressed neither.
Restricting tool calls and database writes cannot enforce this boundary. An intermediate equation or a suggestion to inspect option C can take over part of the student’s task through plain text alone. Mathematical correctness does not tell us whether that assistance belongs at this point in the session.
A test log shows which steps the model generated, not why. That observation is enough to investigate ambiguous instructions, missing context, or unreliable prompting without speculating about the model’s motivations.
Some judgments remain difficult to formalize. Whether a student’s explanation demonstrates sufficient understanding is not always reducible to a boolean condition. We can state the requirement explicitly without guaranteeing that the model will interpret every response accurately.
Because those edge cases persist, evaluating an AI tutor cannot rely on subjective impressions of whether it sounds supportive or instructional. Automated evaluation must test whether specific behaviors occur under defined conditions. If the evaluation criteria are vague, the model evaluating the transcript will simply interpret the teaching intent on its own, and its interpretation may disagree with the model being tested.
## The rubric expresses a product choice too
An earlier update made by our engineering team illustrates this dynamic directly. One of our primary evaluation rubrics contained an item called “Closure reinforces learning”. The original wording required the tutor to deliver a conceptual summary of the core mathematical principle after a student solved a problem, explicitly penalizing generic praise. An engineering co-founder on our team revised this rubric item to make it conditional. If a student had struggled through an incorrect attempt, a hint, or an explicit request for help, the tutor was required to reinforce the concept. But if the student answered correctly on their first attempt without assistance, standard praise was acceptable, and the summary requirement was marked not applicable.
Consider an interaction where a student solves a problem on their first attempt with clear, independent reasoning. The tutor acknowledges the correct answer and closes the session. Under the original rubric, an automated judge would flag this exchange as a failure because the conceptual summary was missing. An engineering team optimizing blindly for that evaluation score would modify the prompt to force an unprompted lecture on a student who had already mastered the material.
**A higher evaluation score does not necessarily mean a better tutor.** The same transcript can pass under an updated rubric without any change to the tutor’s prompt. Engineering must record why the criteria changed rather than attributing the improvement to model capability.
A teaching intention takes three forms: a curriculum discussion with implicit edge cases, a prompt that guides the next response, and a rubric that judges a completed interaction. Each can omit different preconditions. When they disagree, engineers need to know which interpretation they are debugging.
Using a secondary language model as an automated judge introduces another layer of interpretation. The judge model must parse the conversation, determine what the student accomplished, and decide whether a specific rubric item applies before issuing a verdict. Outputting structured JSON makes that verdict easier to store and query, but the schema does not resolve disagreements about what constitutes good teaching.
The evaluation infrastructure I am building is designed to make those judgments inspectable. Our original pipeline passed a full conversation transcript and a broad natural language rubric to a single evaluator model, asking for an overall numerical score and a brief justification. The system I am developing breaks requirements into structured checklist items. Each checklist item has a stable identifier, explicit applicability conditions, and concrete pass/fail criteria. The evaluator returns individual verdicts for each item, accompanied by quoted turn excerpts from the transcript as evidence. This system is currently in active development, and I treat it as an evolving internal tool rather than a proven release gate.
For an over-assistance failure, an engineer needs the exact turn where intermediate reasoning appeared and the preceding student work. A curriculum designer can review that same evidence. Stable item identifiers and quoted turns make disagreements easier to locate, even when they cannot resolve them automatically.
Evaluation runs must also persist the problem definition, prompt version, model identifier, and rubric schema used during execution. If we refine our definition of acceptable assistance, historical evaluation runs executed under the old criteria cannot be compared directly against new runs. Storing the full conversation transcript preserves what actually happened. Re-running a model produces a new observation; an improved reply in a later run should not overwrite the original trace we need to investigate.
Automated pipelines have technical boundaries of their own. Our system uses a student simulator to drive multi-turn conversations through defined scenarios. But a simulator can easily diverge from the intended path, solving a problem without triggering the edge case we set out to test. Even when an automated judge marks every observed checklist item as passing, our scoring logic keeps the overall run marked as inconclusive, returning null values for both the score and the pass status.
A dedicated unit test enforces this requirement in our scoring module:
```json
{
"conclusive": false,
"score": null,
"passed": null,
"inconclusiveReasons": ["scenario_targets_not_reached"]
}
```
A run that misses its target scenario provides no evidence about behavior under those conditions. Marking it as passing creates false confidence; marking it as failing records a violation that never occurred. **Inconclusive is a distinct outcome**, and the scoring code must preserve it.
Reliable evaluation also requires standard backend engineering discipline. In our pipeline, distributed workers pull evaluation tasks from PostgreSQL using database leases, writing versioned checkpoints as multi-turn dialogues progress. Network retries must be strictly idempotent: if a worker commits an evaluation step to the database but loses connection before acknowledging the response, the retry handler must retrieve the committed step rather than re-invoking the model. Re-invoking the model would branch the conversation into a different trajectory, corrupting the transcript history. A dropped network socket or a timeout must be caught as an infrastructure error, never misclassified as an educational failure.
## What engineering has to decide
When reviewing changes to our AI services, I now ask which decisions we are delegating to the model. Freedom to phrase an explanation is different from authority to perform a student’s next step. The distinction has to survive prompt templates, context assembly, and evaluation rubrics. Reading request-handling code alone cannot tell us which action the model will choose during a five-turn dialogue; engineering review has to follow the behavior into the conversation, alongside our curriculum colleagues.
Maintaining this infrastructure has real costs. Changes to tutoring guidelines require updates to prompts, scenarios, and rubrics; model upgrades require re-running historical suites. I do not have clean productivity metrics proving that this saves development hours. What I can point to is a broader set of engineering deliverables: application code, versioned scenarios, and evaluation software that makes behavior inspectable.
There is also a limit to what those deliverables establish. A correct step on our whiteboard does not prove conceptual mastery, and a simulated conversation that follows our rubric provides no evidence about how a real child learns. Our engineering work checks whether the tutor provides the assistance our team agreed upon. Measuring genuine learning outcomes requires long-term educational research.
The original Socratic instruction can remain in our prototype archives. Before our tutor writes out ${b}^{2}=64$, we still have to define how much of that work belonged to the student. We examine what the student wrote, identify the step the tutor supplied, and check it against that decision. As long as a model generates the next response, the product decision remains inside the dialogue. We can design for it deliberately or let the model make it for us.
---
## Computer Networking in Practice: Homelab Network Architecture and Deployment
URL: https://www.qianhechen.com/blog/computer-networking-in-practice-homelab-network-architecture-deployment/
A practical walkthrough of my homelab network architecture: a routed 10G core, VLAN segmentation, DHCP design, managed Wi-Fi, surveillance isolation, and ACL boundaries.

HOME LAB
# Computer Networking in Practice: Homelab Network Architecture and Deployment
May 08, 2026 [homelab](https://www.qianhechen.com/blog/tags/homelab/) [networking](https://www.qianhechen.com/blog/tags/networking/) [vlan](https://www.qianhechen.com/blog/tags/vlan/) [dhcp](https://www.qianhechen.com/blog/tags/dhcp/) [routing](https://www.qianhechen.com/blog/tags/routing/) [wifi](https://www.qianhechen.com/blog/tags/wifi/) [poe](https://www.qianhechen.com/blog/tags/poe/) [surveillance](https://www.qianhechen.com/blog/tags/surveillance/) [huawei](https://www.qianhechen.com/blog/tags/huawei/) [server](https://www.qianhechen.com/blog/tags/server/)
This year I finally brought a Dell R730XD into service with TrueNAS and a RAID6 storage pool. At that point, a gigabit home LAN stopped making sense: the server could provide much more local throughput than the network could carry.
So the first requirement was practical: move the internal backbone to 10G. Once the core was being rebuilt, it also made sense to stop treating the home network as one flat LAN. Servers, cameras, APs, management interfaces, and IoT devices should not all live in the same broadcast domain.
The final architecture is built around a routed 10G core, segmented VLANs, PoE access, centrally managed Wi-Fi, and ACLs at the network boundaries. The goal is to keep the network fast where it matters, isolated where it should be, and simple enough to debug when something breaks.
The core policy is straightforward: VLAN100 is my trusted work/admin network, VLAN99 is infrastructure management, and VLAN30 is surveillance. VLAN100 can administer VLAN99 and VLAN30. VLAN99 and VLAN30 cannot initiate access to other VLANs, and other VLANs cannot reach VLAN100.
## The networking ideas behind the rack
Here are the network concepts that show up repeatedly in this design.
Concept 1
Switching
#### Switches build the physical fabric
A switch connects devices inside a Layer 2 network and forwards Ethernet frames by MAC address.
- Connects router uplinks, server ports, APs, cameras, NVR, and management interfaces.
- Keeps local Ethernet traffic inside the switching fabric.
- Carries multiple logical networks when VLANs are used.
Concept 2
Routing
#### Routers connect IP networks
Routing decides how packets move between subnets and how traffic exits toward the Internet.
- The edge router handles PPPoE and Internet access.
- The core switch routes between internal VLAN gateways.
- Default routes define where unknown destinations go next.
Concept 3
VLANs
#### VLANs define trust boundaries
A VLAN splits one physical switching fabric into separate logical Layer 2 networks.
- Management, cameras, IoT, APs, and trusted work devices do not share one flat LAN.
- Each VLAN gets a clear subnet, gateway, and policy boundary.
- ACLs can then control which VLANs may talk to each other.
Concept 4
Ports
#### Access and trunk ports place VLANs on cables
Port type decides whether one endpoint receives one VLAN or a link carries many VLANs.
- Access ports fit cameras, NVR, and iDRAC because each endpoint belongs to one VLAN.
- Trunk ports fit switch uplinks and APs because they carry several VLANs.
- PVID/native VLAN decides where untagged traffic lands on a trunk.
Concept 5
Addressing
#### DHCP and routes make the network usable
DHCP gives hosts addresses; routes tell devices where to send traffic outside the local subnet.
- Client VLANs receive DHCP service from the core switch.
- AP management DHCP is relayed to the AC so it can provide Option 43.
- The core sends Internet-bound traffic to the router over the routed /30 link.
Concept 6
Operations
#### LACP and PoE make deployment practical
Some network features are less about theory and more about keeping the physical deployment clean.
- LACP bundles multiple links for aggregate capacity and redundancy.
- PoE powers APs and cameras through the same cable that carries data.
- These choices reduce cabling friction and make the network easier to maintain.
With that vocabulary in place, we can move from concepts to the actual homelab topology.
### Homelab Network Map: text description
This text describes the same devices, connections, and configuration as the interactive map.
#### VLAN configuration
| VLAN | Subnet | Gateway | DHCP | Purpose and notes |
| --- | --- | --- | --- | --- |
| VLAN99: Management | 192.168.99.0/24 | 192.168.99.100 | static-only | Infrastructure management plane. Core switch VLANIF99 is the gateway. AC and switches use static management addresses. |
| VLAN10: AP Management | 192.168.10.0/24 | 192.168.10.1 | relay | Access point self addresses. Core switch relays DHCP to the AC at 192.168.11.1. The AC returns Option 43 for controller discovery. |
| VLAN11: AC Control | 192.168.11.0/24 | 192.168.11.2 | static-only | AC control-plane network. The AC uses 192.168.11.1 and the core switch uses 192.168.11.2. |
| VLAN20: Life | 192.168.20.0/24 | 192.168.20.1 | server | Daily household devices. |
| VLAN30: Security | 192.168.30.0/24 | 192.168.30.1 | server | Security SSID, cameras, and NVR. Cameras and NVR are statically assigned inside this VLAN. |
| VLAN100: Work | 192.168.100.0/24 | 192.168.100.1 | server | Workstations and server services. |
| VLAN200: IoT | 192.168.200.0/24 | 192.168.200.1 | server | Smart home devices. |
#### Devices and interfaces
##### Public Internet
The upstream ISP connection reached through PPPoE.
Type: internet.
| Interface | Configuration |
| --- | --- |
| ISP handoff | Peer: Huawei AR5710S-S8T2X MultiGE 0/0/0. Mode: wan. Bandwidth: 1G. Public WAN access enters the router here. |
##### Huawei AR5710S-S8T2X
Edge router handling PPPoE WAN access and the routed handoff to the core switch.
Type: router. Vendor: Huawei. Model: AR5710S-S8T2X.
| Interface | Configuration |
| --- | --- |
| MultiGE 0/0/0 | Peer: ISP. Mode: wan. Bandwidth: 1G. PPPoE dial-up interface for Internet access. |
| 10GE 0/0/1 | IP: 192.168.255.1/30. Peer: Core eth-0-44. Mode: routed. Bandwidth: 10G. Layer 3 point-to-point handoff to the core switch. |
##### 48-port 10G Core Switch
The routed core for VLAN gateways, DHCP services, trunks, and aggregation links.
Type: switch. Model: Centec-based 48x10G SFP+ core switch. Management IP: 192.168.99.100/24. VLANs: VLAN99, VLAN10, VLAN11, VLAN20, VLAN30, VLAN100, VLAN200.
| Interface | Configuration |
| --- | --- |
| Vlanif99 | IP: 192.168.99.100/24. Access VLAN: VLAN99. Management gateway. |
| Vlanif10 | IP: 192.168.10.1/24. Access VLAN: VLAN10. AP management gateway with DHCP relay. |
| Vlanif11 | IP: 192.168.11.2/24. Access VLAN: VLAN11. AC control VLAN gateway. |
| Vlanif20 | IP: 192.168.20.1/24. Access VLAN: VLAN20. Life SSID gateway. |
| Vlanif30 | IP: 192.168.30.1/24. Access VLAN: VLAN30. Security VLAN gateway. |
| Vlanif100 | IP: 192.168.100.1/24. Access VLAN: VLAN100. Work VLAN gateway. |
| Vlanif200 | IP: 192.168.200.1/24. Access VLAN: VLAN200. IoT VLAN gateway. |
| eth-0-44 | IP: 192.168.255.2/30. Peer: Router 10GE 0/0/1. Mode: routed. Bandwidth: 10G. |
| eth-0-41 | Peer: AC XGE0/0/1. Mode: trunk. Bandwidth: 10G. Allowed VLANs: VLAN99, VLAN11. |
| eth-0-45 - eth-0-48 | Peer: PoE switch GE0/0/25 - GE0/0/28. Mode: lacp. Bandwidth: 4 x 1G. Allowed VLANs: VLAN99, VLAN10, VLAN20, VLAN30, VLAN100, VLAN200. LACP group: PoE-uplink. |
| eth-0-25 - eth-0-26 | Peer: Dell R730XD dual 10G. Mode: lacp. Bandwidth: 2 x 10G. Allowed VLANs: VLAN100. LACP group: Server-uplink. |
**DHCP scopes**
- VLAN10: 192.168.10.0/24; gateway 192.168.10.1; server DHCP relay. Relay to 192.168.11.1. AP management DHCP is relayed to the AC.
- VLAN20: 192.168.20.0/24; gateway 192.168.20.1; server Core switch.
- VLAN30: 192.168.30.0/24; gateway 192.168.30.1; server Core switch. The VLAN has DHCP available, while cameras and NVR are statically assigned.
- VLAN100: 192.168.100.0/24; gateway 192.168.100.1; server Core switch.
- VLAN200: 192.168.200.0/24; gateway 192.168.200.1; server Core switch.
**Static routes**
- 0.0.0.0/0 via 192.168.255.1. Default route to the Huawei router.
##### Huawei AirEngine 9700S-S
Wireless access controller for AP onboarding and SSID-to-VLAN policy.
Type: ac. Vendor: Huawei. Model: AirEngine 9700S-S. Management IP: 192.168.99.8/24. VLANs: VLAN99, VLAN11.
| Interface | Configuration |
| --- | --- |
| XGE0/0/1 | Peer: Core eth-0-41. Mode: trunk. Bandwidth: 10G. Allowed VLANs: VLAN99, VLAN11. |
| Vlanif99 | IP: 192.168.99.8/24. Access VLAN: VLAN99. AC management address. |
| Vlanif11 | IP: 192.168.11.1/24. Access VLAN: VLAN11. AC control address and DHCP server endpoint for AP management. |
**DHCP scopes**
- VLAN10: 192.168.10.0/24; gateway 192.168.10.1; server Huawei AirEngine 9700S-S. Option 43: 192.168.11.1. APs receive management addresses and discover the AC through Option 43.
**Static routes**
- 192.168.10.0/24 via 192.168.11.2. Return path to AP management addresses via the core switch.
- 0.0.0.0/0 via 192.168.99.100. Default route via the core management gateway.
- The AC only needs VLAN99 and VLAN11 on its trunk to the core switch.
- Client SSID VLANs are mapped at the AP edge and carried by the PoE access switch trunk.
##### Huawei S1730S-S24P4S-A2
Secondary PoE access switch for APs, cameras, NVR, and iDRAC management.
Type: switch. Vendor: Huawei. Model: S1730S-S24P4S-A2. Management IP: 192.168.99.5/24. VLANs: VLAN99, VLAN10, VLAN20, VLAN30, VLAN100, VLAN200.
| Interface | Configuration |
| --- | --- |
| Vlanif99 | IP: 192.168.99.5/24. Access VLAN: VLAN99. Static management address. |
| GE0/0/25 - GE0/0/28 | Peer: Core eth-0-45 - eth-0-48. Mode: lacp. Bandwidth: 4 x 1G SFP. Allowed VLANs: VLAN99, VLAN10, VLAN20, VLAN30, VLAN100, VLAN200. LACP group: PoE-uplink. |
- AP-facing ports are trunks with native VLAN10 and allowed VLANs 10, 20, 30, 100, and 200.
- Camera and NVR ports are placed in VLAN30 and powered by PoE where applicable.
##### 3 x Huawei Wi-Fi 6 APs
PoE-powered APs. Their own management IPs come from VLAN10, and SSIDs map into service VLANs.
Type: ap. Vendor: Huawei. VLANs: VLAN10, VLAN20, VLAN30, VLAN100, VLAN200.
| Interface | Configuration |
| --- | --- |
| Ethernet uplink | Peer: PoE switch access ports. Mode: trunk. Bandwidth: 1G. Allowed VLANs: VLAN10, VLAN20, VLAN30, VLAN100, VLAN200. Native/PVID: VLAN10. Native VLAN10 for AP management; tagged SSID VLANs for client traffic. |
- AP management addresses are leased from VLAN10.
- Default gateway is 192.168.10.1.
- Option 43 points APs to the AC control address 192.168.11.1.
##### Dell R730XD
Homelab server with dual 10G SFP+ service uplinks and a separate iDRAC management port.
Type: server. Vendor: Dell. Model: R730XD with 0C63DV NIC. Management IP: 192.168.100.45/24. VLANs: VLAN100.
| Interface | Configuration |
| --- | --- |
| X520 SFP+ port 1 and port 2 | Peer: Core eth-0-25 - eth-0-26. Mode: lacp. Bandwidth: 2 x 10G. Allowed VLANs: VLAN100. LACP group: Server-uplink. Business/service network uplink. |
| Service IP | IP: 192.168.100.45/24. Access VLAN: VLAN100. Default gateway is 192.168.100.1. |
##### Dell iDRAC
Out-of-band server management connected to the PoE access switch.
Type: server. Vendor: Dell. Management IP: 192.168.99.56/24. VLANs: VLAN99.
| Interface | Configuration |
| --- | --- |
| iDRAC Ethernet | IP: 192.168.99.56/24. Peer: PoE switch access port. Mode: access. Access VLAN: VLAN99. Default gateway is 192.168.99.100. |
##### 4 x Hikvision Cameras
PoE-powered security cameras with static addresses in VLAN30.
Type: camera. Vendor: Hikvision. VLANs: VLAN30.
| Interface | Configuration |
| --- | --- |
| Camera Ethernet | Peer: PoE switch camera ports. Mode: access. Bandwidth: 1G. Access VLAN: VLAN30. PoE powered; static IPs in 192.168.30.0/24. |
##### Hikvision NVR
Recorder placed directly on VLAN30 so camera traffic stays inside the security segment.
Type: nvr. Vendor: Hikvision. VLANs: VLAN30.
| Interface | Configuration |
| --- | --- |
| NVR Ethernet | Peer: PoE switch access port. Mode: access. Bandwidth: 1G. Access VLAN: VLAN30. Static IP in 192.168.30.0/24. |
#### Network connections
| Connection | Endpoints | Configuration |
| --- | --- | --- |
| PPPoE WAN | Public Internet → Huawei AR5710S-S8T2X(MultiGE 0/0/0) | Type: wan. Bandwidth: 1G. |
| 192.168.255.0/30 | Huawei AR5710S-S8T2X(10GE 0/0/1) → 48-port 10G Core Switch(eth-0-44) | Type: routed. Bandwidth: 10G. Routed subnet: 192.168.255.0/30. Router side: 192.168.255.1/30. Core side: 192.168.255.2/30. |
| Trunk 99,11 | 48-port 10G Core Switch(eth-0-41) → Huawei AirEngine 9700S-S(XGE0/0/1) | Type: trunk. Bandwidth: 10G. Allowed VLANs: VLAN99, VLAN11. |
| LACP trunk | 48-port 10G Core Switch(eth-0-45 - eth-0-48) → Huawei S1730S-S24P4S-A2(GE0/0/25 - GE0/0/28) | Type: lacp. Bandwidth: 4 x 1G. Allowed VLANs: VLAN99, VLAN10, VLAN20, VLAN30, VLAN100, VLAN200. LACP group: PoE-uplink. |
| LACP 2 x 10G | 48-port 10G Core Switch(eth-0-25 - eth-0-26) → Dell R730XD(X520 SFP+ dual ports) | Type: lacp. Bandwidth: 2 x 10G. Allowed VLANs: VLAN100. LACP group: Server-uplink. |
| Access VLAN99 | Huawei S1730S-S24P4S-A2 → Dell iDRAC(iDRAC Ethernet) | Type: access. Allowed VLANs: VLAN99. |
| PoE trunk | Huawei S1730S-S24P4S-A2 → 3 x Huawei Wi-Fi 6 APs | Type: trunk. Bandwidth: 1G each. Allowed VLANs: VLAN10, VLAN20, VLAN30, VLAN100, VLAN200. Native/PVID: VLAN10. PoE enabled. |
| PoE access VLAN30 | Huawei S1730S-S24P4S-A2 → 4 x Hikvision Cameras | Type: access. Bandwidth: 1G each. Allowed VLANs: VLAN30. PoE enabled. |
| Access VLAN30 | Huawei S1730S-S24P4S-A2 → Hikvision NVR | Type: access. Bandwidth: 1G. Allowed VLANs: VLAN30. |
| CAPWAP/control | 3 x Huawei Wi-Fi 6 APs → Huawei AirEngine 9700S-S | Type: trunk. Allowed VLANs: VLAN10, VLAN11. APs get VLAN10 addresses from the AC DHCP scope. Option 43 points to the AC control address 192.168.11.1. |
| VLAN30 video | 4 x Hikvision Cameras → Hikvision NVR | Type: access. Allowed VLANs: VLAN30. The cameras and NVR are in the same security VLAN, so recording traffic does not need to leave VLAN30. |
#### Wireless networks
| SSID | VLAN | Purpose |
| --- | --- | --- |
| SSID-Work | VLAN100 | Work devices and trusted client access. |
| SSID-Life | VLAN20 | Daily household devices. |
| SSID-Security | VLAN30 | Security clients and camera-related access. |
| SSID-IoT | VLAN200 | Smart home and lower-trust devices. |
#### Traffic paths
- **Internet egress:** Client or server traffic reaches the core default route, crosses the /30 handoff, and exits through PPPoE. Devices: Dell R730XD → 48-port 10G Core Switch → Huawei AR5710S-S8T2X → Public Internet.
- **AP discovery:** APs obtain VLAN10 addresses through DHCP relay and discover the AC at 192.168.11.1 by Option 43. Devices: 3 x Huawei Wi-Fi 6 APs → Huawei S1730S-S24P4S-A2 → 48-port 10G Core Switch → Huawei AirEngine 9700S-S.
- **SSID-Work traffic:** Wireless clients on SSID-Work are bridged to VLAN100 and use the core switch as their gateway. Devices: 3 x Huawei Wi-Fi 6 APs → Huawei S1730S-S24P4S-A2 → 48-port 10G Core Switch.
- **Camera to NVR:** Camera streams stay in VLAN30 between the PoE switch, cameras, and NVR. Devices: 4 x Hikvision Cameras → Huawei S1730S-S24P4S-A2 → Hikvision NVR.
- **Server gateway:** The Dell server uses VLAN100 through the dual-10G LACP bundle and reaches its gateway at 192.168.100.1. Devices: Dell R730XD → 48-port 10G Core Switch.
## Topology summary
The network is built around a routed core.
```mermaid
flowchart LR
Internet["Public Internet"] -->|"PPPoE"| Router["Huawei AR5710S-S8T2X"]
Router -->|"10G routed link 192.168.255.0/30"| Core["48-port 10G core switch"]
Core -->|"10G trunk VLAN99,11"| AC["Huawei AirEngine 9700S-S"]
Core -->|"4 x 1G LACP trunk"| PoESwitch["Huawei PoE access switch"]
Core -->|"2 x 10G LACP"| Server["Dell R730XD services"]
PoESwitch --> APs["Huawei Wi-Fi 6 APs"]
PoESwitch --> Cameras["Hikvision cameras"]
PoESwitch --> NVR["Hikvision NVR"]
PoESwitch --> iDRAC["Dell iDRAC"]
```
| Role | Device | Purpose |
| --- | --- | --- |
| Edge router | Huawei AR5710S-S8T2X | PPPoE WAN and routed handoff to the core |
| Core switch | 48-port 10G SFP+ switch, Centec chipset | VLAN gateways, DHCP, DHCP relay, default route, aggregation |
| Access switch | Huawei S1730S-S24P4S-A2 | PoE access for APs and cameras, NVR, iDRAC, trunk to core |
| Wireless controller | Huawei AirEngine 9700S-S | AP discovery, AP management, SSID policy |
| Wireless APs | Huawei Wi-Fi 6 APs | Client access, SSID-to-VLAN mapping |
| Server | Dell R730XD with 0C63DV NIC | Services on VLAN100, dual-10G LACP to core |
| Surveillance | Hikvision cameras and NVR | Static security devices on VLAN30 |
## Physical links
The WAN enters the router on `MultiGE 0/0/0` and uses PPPoE over a 1G public uplink.
The router connects to the core through a routed point-to-point link:
| Link | Type | VLANs / IPs |
| --- | --- | --- |
| Router `MultiGE 0/0/0` to ISP | WAN | 1G PPPoE |
| Router `10GE 0/0/1` to core `eth-0-44` | Routed | Router `192.168.255.1/30`, core `192.168.255.2/30` |
| Core `eth-0-41` to AC `XGE0/0/1` | Trunk | VLAN99, VLAN11 |
| Core `eth-0-45-48` to access switch `GE0/0/25-28` | LACP trunk | VLAN99,10,20,30,100,200 |
| Core `eth-0-25-26` to Dell R730XD | LACP | VLAN100 |
| Access switch to APs | PoE trunk | Native VLAN10, allowed VLAN10,20,30,100,200 |
| Access switch to cameras and NVR | Access | VLAN30 |
| Access switch to iDRAC | Access | VLAN99 |
## VLANs, gateways, and DHCP
The core switch owns the routed VLAN interfaces for the main internal networks:
| VLAN | Role | Gateway | DHCP |
| --- | --- | --- | --- |
| 99 | Management | `192.168.99.100/24` | Static |
| 10 | AP management | `192.168.10.1/24` | Relay to AC `192.168.11.1` |
| 11 | AC control | `192.168.11.2/24` | Static |
| 20 | Life / daily devices | `192.168.20.1/24` | Core switch |
| 30 | Security / cameras / NVR | `192.168.30.1/24` | Core switch, with cameras/NVR static |
| 100 | Work and server services | `192.168.100.1/24` | Core switch |
| 200 | Smart home / IoT | `192.168.200.1/24` | Core switch |
VLAN99 is the management plane. The core switch uses `192.168.99.100/24`, the AC uses `192.168.99.8/24`, the access switch uses `192.168.99.5/24`, and iDRAC uses `192.168.99.56/24`.
VLAN10 is only for AP management. APs receive addresses by DHCP and use `192.168.10.1` as their gateway.
VLAN11 is the AC control network. The AC uses `192.168.11.1/24`; the core uses `192.168.11.2/24`.
The core switch directly serves DHCP for VLAN20, VLAN30, VLAN100, and VLAN200. VLAN10 is relayed to the AC:
```text
VLAN10 DHCP relay -> 192.168.11.1
```
The AC DHCP pool for APs is:
- Subnet: `192.168.10.0/24`
- Gateway: `192.168.10.1`
- Option 43: `192.168.11.1`
## Routing model
The core switch is the default gateway for the internal VLANs. The router is the Internet edge.
```text
Core default route: 0.0.0.0/0 -> 192.168.255.1
```
```mermaid
flowchart LR
VlanGateway["VLAN gateway on core"] --> CoreRoute["Core default route"]
CoreRoute -->|"0.0.0.0/0 via 192.168.255.1"| Router["Huawei router"]
Router -->|"PPPoE"| Internet["Public Internet"]
```
This keeps internal routing close to the switching fabric. Traffic between VLANs reaches the core directly. Internet-bound traffic leaves through the router.
## Wireless
The AP-facing switch ports are trunks:
- Native / PVID VLAN: `10`
- Allowed VLANs: `10, 20, 30, 100, 200`
| SSID | VLAN | Purpose |
| --- | --- | --- |
| `SSID-Work` | 100 | Trusted work/admin devices |
| `SSID-Life` | 20 | Daily household devices |
| `SSID-Security` | 30 | Security clients and camera-related access |
| `SSID-IoT` | 200 | Smart home devices |
The AC trunk only carries VLAN99 and VLAN11. Client VLANs are mapped at the AP edge and carried through the AP-to-access-switch trunk, then through the access-to-core trunk.
The AC has two important routes:
```text
192.168.10.0/24 -> 192.168.11.2
0.0.0.0/0 -> 192.168.99.100
```
The first route is the return path to AP management addresses. The second route sends other AC traffic to the core management gateway.
## Server and surveillance placement
The Dell R730XD has two network roles:
| Role | VLAN | Address | Gateway | Link |
| --- | --- | --- | --- | --- |
| Services | 100 | `192.168.100.45/24` | `192.168.100.1` | Dual 10G LACP to core |
| iDRAC | 99 | `192.168.99.56/24` | `192.168.99.100` | Access switch port |
The iDRAC path is separate from the service path. I can change the server data network without losing out-of-band management.
The cameras and NVR are placed in VLAN30 with static addresses. Camera-to-NVR traffic stays inside the security VLAN.
The resulting surveillance path is short:
```mermaid
flowchart LR
Cameras["Hikvision cameras"] -->|"VLAN30 video streams"| PoESwitch["PoE access switch"]
PoESwitch -->|"VLAN30 access"| NVR["Hikvision NVR"]
PoESwitch -->|"Trunk VLAN30"| CoreSwitch["Core switch gateway 192.168.30.1"]
```
## ACL policy
The VLAN policy is intentionally strict. VLAN100 is my trusted network and is effectively single-user. It is the only VLAN allowed to initiate access into the management and security networks.
| Source | Destination | Action | Reason |
| --- | --- | --- | --- |
| VLAN100 | VLAN99 | Allow | Admin access to switches, AC, and iDRAC |
| VLAN100 | VLAN30 | Allow | Admin access to cameras and NVR |
| VLAN99 | Any non-management VLAN | Deny | Management devices should not initiate access to clients or services |
| VLAN30 | Any other VLAN | Deny | Cameras and NVR should not initiate access outside the security network |
| VLAN10, VLAN11, VLAN20, VLAN30, VLAN99, VLAN200 | VLAN100 | Deny | VLAN100 should not be reachable from other VLANs |
| VLAN10, VLAN11, VLAN20, VLAN200 | VLAN99 | Deny | Only VLAN100 can manage infrastructure |
| VLAN10, VLAN11, VLAN20, VLAN200 | VLAN30 | Deny | Only VLAN100 can reach the security network |
In short:
- VLAN99 and VLAN30 are protected destinations.
- Only VLAN100 can initiate traffic to VLAN99 and VLAN30.
- VLAN30 and VLAN99 cannot initiate traffic to other VLANs.
- VLAN100 is not reachable from other VLANs.
The policy direction is easier to see as a graph:
```mermaid
flowchart LR
Vlan100["VLAN100 Work/Admin"] -->|"allow admin"| Vlan99["VLAN99 Management"]
Vlan100 -->|"allow admin"| Vlan30["VLAN30 Security"]
Vlan20["VLAN20 Life"] -. "deny" .-> Vlan99
Vlan20 -. "deny" .-> Vlan30
Vlan200["VLAN200 IoT"] -. "deny" .-> Vlan99
Vlan200 -. "deny" .-> Vlan30
Vlan10["VLAN10 AP Management"] -. "deny" .-> Vlan100
Vlan30 -. "deny initiate" .-> Vlan100
Vlan99 -. "deny initiate" .-> Vlan100
```
This is the point where the network becomes operationally useful. The physical design gives every device a clear place. The VLAN design gives every group a clear subnet. The ACL policy defines which boundaries are real.
---
## Step into Development: A Beginner's Guide
URL: https://www.qianhechen.com/blog/dev101/
Dev 101 checklist of essential developer tools and resources: Git/GitHub, Svelte/SvelteKit, React/Vue, Next/Nuxt, Tailwind, Python tooling, code editors (VS Code/JetBrains), and AI assistants.

HANDBOOK
# Step into Development: A Beginner's Guide
Oct 09, 2024 [dev101](https://www.qianhechen.com/blog/tags/dev101/) [developer-tools](https://www.qianhechen.com/blog/tags/developer-tools/) [git](https://www.qianhechen.com/blog/tags/git/) [github](https://www.qianhechen.com/blog/tags/github/) [svelte](https://www.qianhechen.com/blog/tags/svelte/) [sveltekit](https://www.qianhechen.com/blog/tags/sveltekit/) [react](https://www.qianhechen.com/blog/tags/react/) [next](https://www.qianhechen.com/blog/tags/next/) [vue](https://www.qianhechen.com/blog/tags/vue/) [nuxt](https://www.qianhechen.com/blog/tags/nuxt/) [tailwindcss](https://www.qianhechen.com/blog/tags/tailwindcss/) [python](https://www.qianhechen.com/blog/tags/python/) [vscode](https://www.qianhechen.com/blog/tags/vscode/) [ai-tools](https://www.qianhechen.com/blog/tags/ai-tools/)
This guide outlines essential tools you’ll encounter in development and provides a lightweight checklist to help you navigate the landscape of software development.
## 1\. Code management and collaboration
- **Git**: Learn version control to track and manage your code changes — [git-scm.com](https://git-scm.com/)
- **GitHub**: Collaborate with others and showcase your projects — [github.com](https://github.com/)
- **Git Flow**: A branching model for Git — [nvie.com posts](https://nvie.com/posts/a-successful-git-branching-model/)
- **Conventional Commits**: A specification for adding meaning to commit messages — [conventionalcommits.org](https://www.conventionalcommits.org/en/v1.0.0/)
- **Markdown**: Master this lightweight markup language for documentation — [markdownguide.org](https://www.markdownguide.org/)
## 2\. Front-end and Full-stack Frameworks
Front-end frameworks help build modern, interactive web applications:
- **Svelte**: A modern compiler-powered framework for building user interfaces — [svelte.dev](https://svelte.dev/)
- **Vue.js**: A progressive JavaScript framework for building user interfaces — [vuejs.org](https://vuejs.org/)
- **React**: A JavaScript library for building user interfaces — [reactjs.org](https://reactjs.org/)
Full-stack frameworks provide a full-stack solution (front-end + back-end):
- **SvelteKit**: The official application framework for Svelte — [kit.svelte.dev](https://kit.svelte.dev/)
- **Next.js**: The React framework for production — [nextjs.org](https://nextjs.org/)
- **Nuxt.js**: The intuitive Vue framework — [nuxtjs.org](https://nuxtjs.org/)
## 3\. UI Component Libraries
UI component libraries can speed up development and help create consistent, attractive UIs:
- **Tailwind CSS**: Utility-first CSS framework for rapidly building custom designs — [tailwindcss.com](https://tailwindcss.com/)
- **Ant Design**: A design system for enterprise-level products — [ant.design](https://ant.design/)
- **shadcn/ui**: Beautifully designed components you can copy and paste — [ui.shadcn.com](https://ui.shadcn.com/)
- **Element Plus**: Vue 3 based component library for designers and developers — [element-plus.org](https://element-plus.org/)
## 4\. Design and Development Tools
Tools that enhance your design process and help you inspect/debug your UI:
- **Figma**: Collaborative interface design tool — [figma.com](https://www.figma.com/)
- **Chrome DevTools**: Built-in developer tools in Chrome — [developer.chrome.com](https://developer.chrome.com/docs/devtools/)
- **Chrome DevTools Intro**: Notes on using Chrome DevTools — [Feishu doc](https://fyze31atzb.feishu.cn/docx/Lfjwdp3JEoZm0dxK5hqcfR4lnOe)
## 5\. Python-based Development Tools
Python is widely used across domains. Here are essential Python tools/libraries:
- **Python**: A powerful, easy-to-learn programming language — [python.org](https://www.python.org/)
- **Python Cookbook**: Comprehensive guide to Python programming recipes — [readthedocs](https://python3-cookbook.readthedocs.io/zh-cn/latest/index.html)
- **Python Type Hints**: Static typing for Python — [typing docs](https://docs.python.org/3/library/typing.html)
- **pip**: The package installer for Python — [pip.pypa.io](https://pip.pypa.io)
- **venv**: Python’s built-in virtual environment module — [venv docs](https://docs.python.org/3/library/venv.html)
- **virtualenv**: Create isolated Python environments — [virtualenv docs](https://virtualenv.pypa.io/en/latest/)
- **conda**: Package/dependency/environment management — [conda docs](https://docs.conda.io/en/latest/)
- **pyenv**: Simple Python version management — [GitHub](https://github.com/pyenv/pyenv)
- **uv**: Extremely fast Python package installer and resolver — [docs.astral.sh/uv](https://docs.astral.sh/uv/)
- **Black**: The uncompromising Python code formatter — [black docs](https://black.readthedocs.io/en/stable/)
- **FastAPI**: Modern, fast web framework for building APIs — [fastapi.tiangolo.com](https://fastapi.tiangolo.com/)
- **PyTorch**: Open source machine learning framework — [pytorch.org](https://pytorch.org/)
- **ONNX**: Open Neural Network Exchange — [onnx.ai](https://onnx.ai/)
- **NumPy**: Fundamental package for scientific computing — [numpy.org](https://numpy.org/)
- **Pandas**: Data analysis and manipulation tool — [pandas.pydata.org](https://pandas.pydata.org/)
When setting up your Python development environment, consider:
- **Environment Management**: Use virtual environments (or tools like uv) to isolate dependencies and avoid conflicts.
- **Code Formatting**: Use a formatter like Black to keep code consistent across projects.
- **Type Annotations**: Use type hints and tools like mypy for static checks to catch errors early.
By selecting and combining these tools, you can build a robust Python development environment tailored to your needs.
## 6\. Recommended Code Editors
Choosing the right editor can significantly improve your development experience:
- **JetBrains IDEs**: Professional tools for students (free) and developers — [jetbrains.com](https://www.jetbrains.com/)
- **Visual Studio Code**: Free, powerful, rich plugin ecosystem — [code.visualstudio.com](https://code.visualstudio.com/)
- **GitHub Codespaces**: Remote dev environment provided by GitHub — [feature page](https://github.com/features/codespaces)
- **Cursor**: AI-powered code editor — [cursor.sh](https://cursor.sh/)
Each option has trade-offs:
- JetBrains IDEs: free for students, feature-rich, user-friendly.
- VS Code: free, powerful ecosystem, compatible with many technologies.
- Codespaces: remote environment with good connectivity and pre-configured setups.
- Cursor: AI-first features; may have stability/compatibility issues depending on your setup.
Explore them and pick the one that fits your workflow.
## 7\. AI-powered Development Tools
AI tools can boost productivity and help with code generation, problem solving, and documentation:
- **Claude**: AI assistant — [anthropic.com](https://www.anthropic.com/)
- **ChatGPT**: Versatile AI chatbot — [chat.openai.com](https://chat.openai.com/)
- **GitHub Copilot**: AI pair programmer — [feature page](https://github.com/features/copilot)
- **Cursor**: AI-powered code editor — [cursor.sh](https://cursor.sh/)
- **v0**: AI-assisted design tool for rapid prototyping — [v0.dev](https://v0.dev/)
- **Gamma**: AI-assisted presentation/document tool — [gamma.app](https://gamma.app/)
Experiment and keep what truly improves your day-to-day.
## 8\. Other Essential Tools
Tools that help you stay connected and collaborate:
- **X (formerly Twitter)** — [x.com](https://x.com/)
- **Telegram** — [telegram.org](https://telegram.org/)
- **Notion**: All-in-one workspace — [notion.so](https://www.notion.so/)
> ### ⚠️ Important Safety Notice
>
> As you explore these tools and engage with the tech community, always prioritize your information security and personal safety:
>
> - Be cautious of potential scams or illegal activities
> - Protect your personal information
> - Verify the authenticity of resources and contacts
>
> Remember: Your actions and their consequences are your own responsibility. The creators and maintainers of this guide are not liable for any misuse or negative outcomes resulting from the use of these tools or resources.
These tools can help you stay connected with the tech community, manage projects efficiently, and collaborate effectively with team members.
---
## From Hikvision NVR to Frigate on TrueNAS
URL: https://www.qianhechen.com/blog/frigate-hikvision-cameras-migration/
How I moved Hikvision cameras to VLAN-based RTSP streams and Frigate on TrueNAS with NVIDIA P4 GPU acceleration and YOLO ONNX detection.

HOME LAB
# From Hikvision NVR to Frigate on TrueNAS
Jan 03, 2026 [frigate](https://www.qianhechen.com/blog/tags/frigate/) [camera](https://www.qianhechen.com/blog/tags/camera/) [self-hosting](https://www.qianhechen.com/blog/tags/self-hosting/) [home-assistant](https://www.qianhechen.com/blog/tags/home-assistant/) [rtsp](https://www.qianhechen.com/blog/tags/rtsp/) [go2rtc](https://www.qianhechen.com/blog/tags/go2rtc/) [hikvision](https://www.qianhechen.com/blog/tags/hikvision/) [ai](https://www.qianhechen.com/blog/tags/ai/) [yolo](https://www.qianhechen.com/blog/tags/yolo/) [gpu](https://www.qianhechen.com/blog/tags/gpu/) [nvidia](https://www.qianhechen.com/blog/tags/nvidia/) [p4](https://www.qianhechen.com/blog/tags/p4/)
## TL;DR
I kept the Hikvision NVR for storage, but moved detection to [Frigate](https://frigate.video/) on my TrueNAS server. With zones, an ONNX YOLO detector, and an NVIDIA P4 for acceleration, I now get smarter alerts and a web UI that works perfectly on macOS.
## Why I moved off the NVR
Last year, after moving into a new home, we installed four Hikvision cameras. I initially connected everything to a Hikvision NVR for live view and recording. It worked, but I soon ran into limitations.
```mermaid
flowchart TB
subgraph Before["Before: NVR isolates the cameras"]
VLAN3[VLAN 3] --> NVR["Hikvision NVR (on VLAN 3)"]
NVR -->|built-in PoE / internal switch| CamNet["Camera subnet 192.168.254.x"]
CamNet --> C1["Camera 1"]
CamNet --> C2["Camera 2"]
CamNet --> C3["Camera 3"]
CamNet --> C4["Camera 4"]
Mac[Mac on home network] -->|no direct access| CamNet
end
```
The biggest surprise was networking. The NVR sat on **VLAN 3**, and all cameras were physically connected to the NVR. That meant the cameras lived behind the NVR on its private camera subnet (for example `192.168.254.x`). From my normal home network I could not reach the cameras directly, so I assumed the NVR was the only gateway.
That assumption became painful because my daily machine is a **Mac**.
Hikvision’s web interface required browser plugins that only worked well on Windows, and the desktop client was not a good option on macOS. Checking the cameras became a chore, so I started looking for a setup that would work cleanly from macOS.
I even tried running a **Windows virtual machine** on my Mac. It worked, but it was clunky. Camera settings were slow to reach, and some configuration flows felt incomplete.
I also tried to keep the NVR at the center and forward video elsewhere via **RTSP**. That turned into a full day of debugging: the RTSP streams coming out of the NVR were not decodable in my setup.
Only after watching a few videos did I realize the obvious approach: connect the cameras to my network directly, log into each camera’s admin page, and grab RTSP from the source.
The first step was simple: move the cameras onto **VLAN 3 directly** so they have normal IPs and can be accessed and integrated like any other device.
```mermaid
flowchart TB
subgraph After["After: cameras on VLAN 3 directly"]
VLAN3a[VLAN 3] --> C1a["Camera 1 (VLAN 3 IP)"]
VLAN3a --> C2a["Camera 2 (VLAN 3 IP)"]
VLAN3a --> C3a["Camera 3 (VLAN 3 IP)"]
VLAN3a --> C4a["Camera 4 (VLAN 3 IP)"]
Maca[Mac on home network] -->|routed access| VLAN3a
end
```
## The migration: TrueNAS Apps + Frigate
Once the cameras were on VLAN 3, I wanted two things: something I could use daily on macOS, and a clean path to **smarter detection and automation**. That’s when I started building around [Frigate](https://frigate.video/).
I installed Frigate from the **TrueNAS Apps** catalog. It kept updates, storage paths, and GPU access in one place, and it made the whole setup feel like a “real” service instead of another weekend experiment.
I’m not going to paste my full config here. It is long and it changes as I iterate. Instead, I keep an up-to-date config and notes in a [Github Gist](https://gist.github.com/chenqianhe/4b8838afb4597dff3f9ec07da55e148d).
From there, I added the cameras via RTSP. I started boring: confirm each stream decodes reliably first, then enable detection.
One small decision made everything easier to run and easier to debug:
- Use a lower-resolution sub-stream for detection (lower latency, cheaper to run)
- Keep a higher-quality stream for live view and storage
Once detection was running across multiple cameras, I enabled **GPU acceleration** with an NVIDIA P4 to keep the system responsive.
## The model detour: YOLO-NAS → YOLOv9
Frigate’s [documentation](https://docs.frigate.video/configuration/object_detectors#yolo-nas-1) recommended **YOLO-NAS**, and it even provided a notebook that claims you can run it and export a final ONNX model.
In my case, that notebook did **not** run end-to-end. After a lot of time spent trying to reproduce the “happy path” (and seeing many similar complaints online), I stopped fighting it.
So I switched back to a classic YOLO workflow. I decided to try **YOLOv9**, exported it to ONNX locally, and plugged that ONNX model into Frigate. That was the moment the detection pipeline finally felt “done”.
If you are choosing a detector model today, my recommendation is simple: follow the official Frigate documentation, convert a supported YOLO model to ONNX, and skip YOLO-NAS. For me, YOLO-NAS was a disaster and it was surprisingly hard to get a clean, reproducible export.
## Results
I ended up with a hybrid setup that fits my priorities:
- Storage and playback: Hikvision NVR
- Detection: Frigate (zones + ONNX model)
- Acceleration: NVIDIA P4
Most importantly, everything is accessible from the web UI. That means my Mac workflow is no longer blocked by vendor plugins or Windows-only tooling.
## Lessons learned
- **Get RTSP from the camera, not the NVR.** Debugging “mystery” NVR streams is a time sink.
- Keep detection cheap: **use a sub-stream for detect**, and save the main stream for viewing/storage.
- Prefer boring, well-supported model paths (**YOLO** → ONNX). YOLO-NAS was not worth the hassle for me.
If you want the exact config (go2rtc restreams, camera streams, zones, and the ONNX model path), I keep it updated here:
- [config.yml gist](https://gist.github.com/chenqianhe/4b8838afb4597dff3f9ec07da55e148d)
---
## Hello, Blog
URL: https://www.qianhechen.com/blog/hello-blog-2025-12-26/
Why I’m adding a blog to this homepage, and how it’s structured.
# Hello, Blog
Dec 26, 2025 [meta](https://www.qianhechen.com/blog/tags/meta/) [astro](https://www.qianhechen.com/blog/tags/astro/) [svelte](https://www.qianhechen.com/blog/tags/svelte/)
This homepage already separates **structured data** (like `journey`) from **rich text** (like `home`).
For blog posts, Markdown works best:
- Easy to write and review
- Great Git history (one post = one file)
- Simple static generation via Astro Content Collections
Next steps I want:
- RSS feed
- Tag page (`/blog/tags/:tag`)
- Reading time + table of contents
Here is a small code block to verify syntax highlighting:
```ts
interface Post {
title: string;
slug: string;
}
export function urlFor(post: Post): string {
return `/blog/${post.slug}/`;
}
```
---
## M5 Ultra for Local LLMs: 256GB vs. 512GB and DGX Spark
URL: https://www.qianhechen.com/blog/m5-ultra-local-llm-256gb-vs-512gb-dgx-spark/
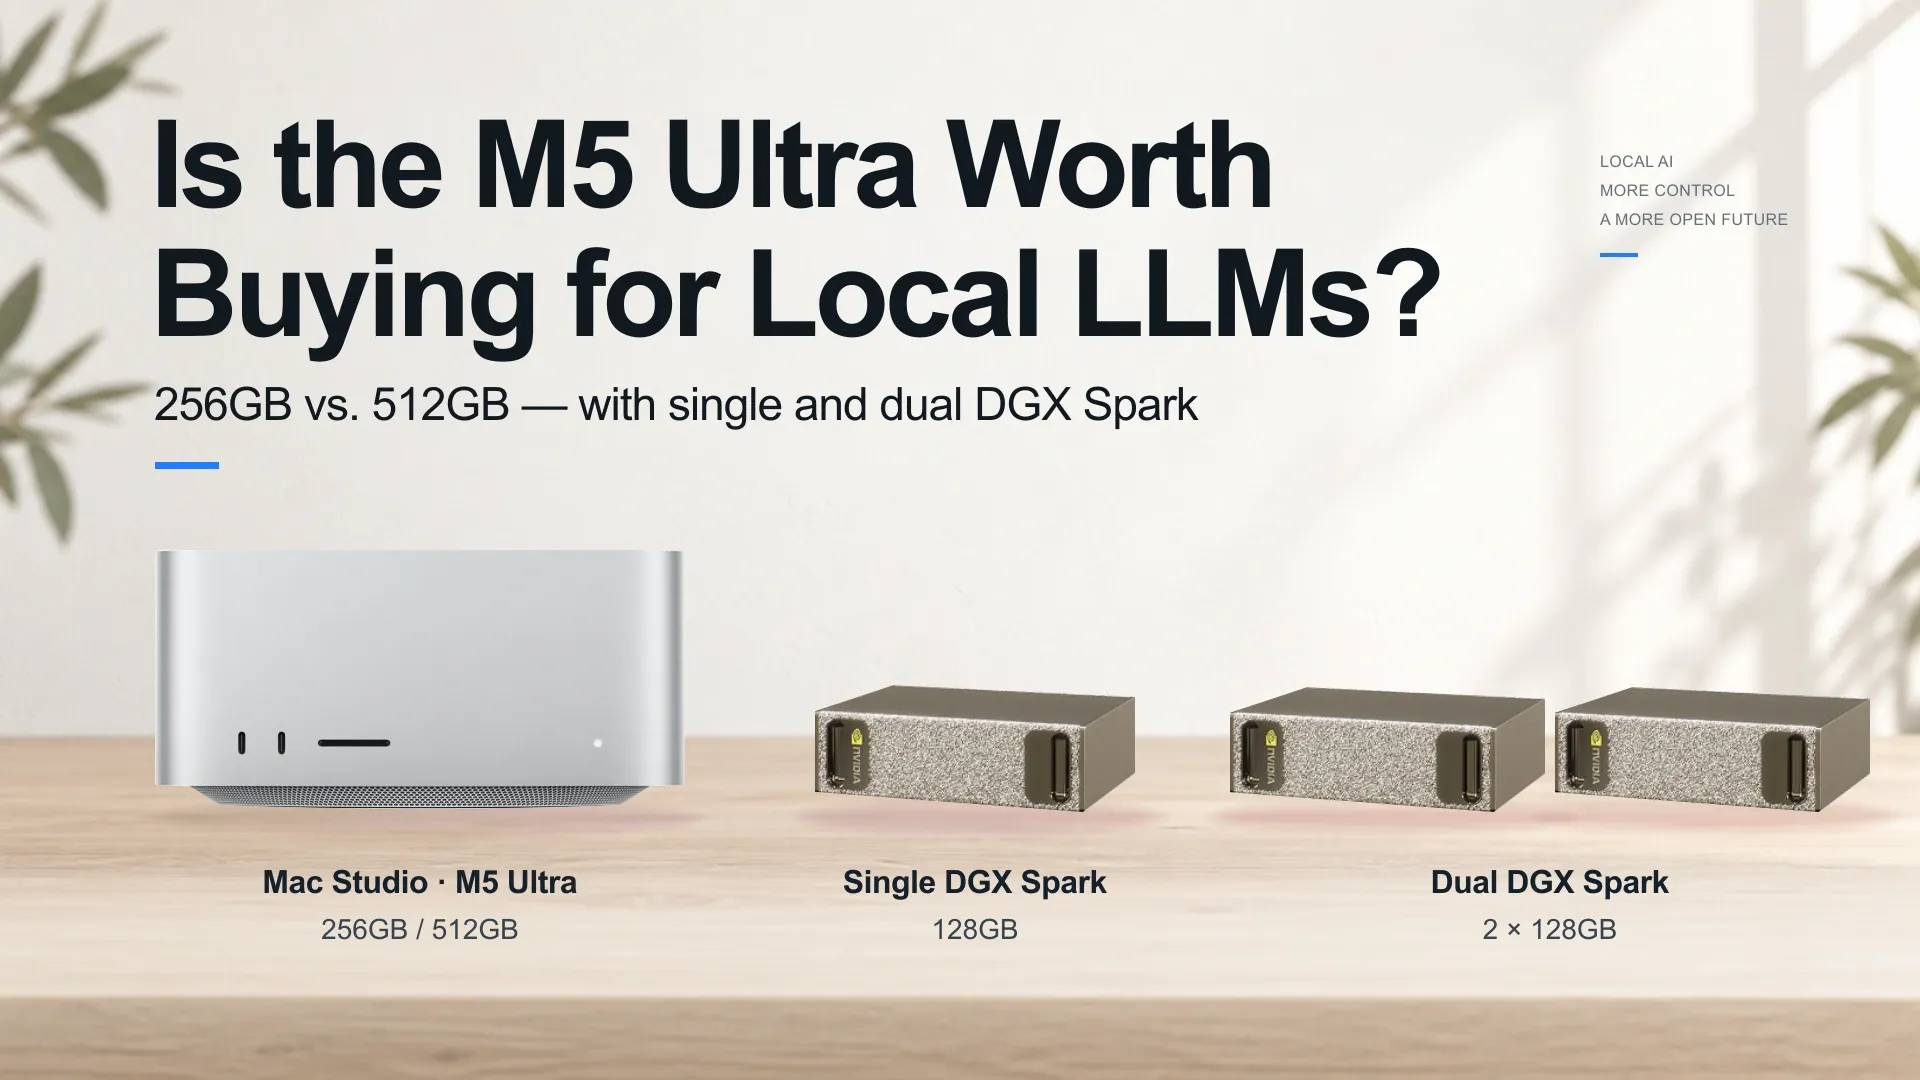
An analytical buyer's guide to the M5 Ultra Mac Studio for local LLMs. Comparing 256GB, 512GB, and NVIDIA DGX Spark for DeepSeek-V4-Flash and GLM-5.3 inference.
HARDWARE & AI ENGINEERING
# M5 Ultra for Local LLMs: 256GB vs. 512GB and DGX Spark
Sep 08, 2026 [M5 Ultra](https://www.qianhechen.com/blog/tags/m5-ultra/) [Apple Silicon](https://www.qianhechen.com/blog/tags/apple-silicon/) [Mac Studio](https://www.qianhechen.com/blog/tags/mac-studio/) [NVIDIA DGX Spark](https://www.qianhechen.com/blog/tags/nvidia-dgx-spark/) [Local LLM](https://www.qianhechen.com/blog/tags/local-llm/) [Mixture of Experts](https://www.qianhechen.com/blog/tags/mixture-of-experts/) [Speculative Decoding](https://www.qianhechen.com/blog/tags/speculative-decoding/) [Memory Bandwidth](https://www.qianhechen.com/blog/tags/memory-bandwidth/) [Hardware Benchmarks](https://www.qianhechen.com/blog/tags/hardware-benchmarks/)
_256GB vs. 512GB, with single and dual DGX Spark as reference points_
_Analysis date: September 8, 2026. This evaluation is an analytical buying framework based on published hardware specifications, community benchmarks, and scaling models prior to retail delivery._
* * *
Is the M5 Ultra 256GB the most sensible configuration to buy?
**The 256GB M5 Ultra is the best-balanced candidate on paper for DeepSeek-V4-Flash-class inference.** Its capacity accommodates the [referenced checkpoint](https://huggingface.co/Vontra/DeepSeek-V4-Flash-0731-MXFP4-MLX), subject to runtime and context allocations. Approaching 60 tokens/s remains conditional on speculative acceptance, runtime support, and retail measurements. The 80-core GPU premium should be evaluated through prefill and verification workloads.
What does the 512GB configuration actually deliver for its premium?
**It primarily expands checkpoint capacity while retaining the same 1.2TB/s nominal memory bandwidth.** The 512GB tier can accommodate the ~365GB GLM-5.3 UD-IQ4\_XS checkpoint, subject to runtime and context requirements. It allows larger checkpoints and some less aggressively compressed 4-bit variants, but does not generally make this model’s Q5 or Q6 versions practical. At **60 committed tokens/s under one-forward-per-token decoding**, reading **40B uniformly quantized 4-bit active parameters** would alone require **1.2TB/s**. Speculative verification can commit several tokens per forward, so its costs need a separate model.
Does the NVIDIA DGX Spark remain competitive for local single-user inference?
**Dual Sparks remain a candidate for CUDA-based workflows, subject to model quality and workload requirements.** A [community DSpark recipe](https://forums.developer.nvidia.com/t/deepseek-v4-flash-dspark-on-2x-dgx-spark-gb10-big-single-stream-speed-boost-60-67-tok-s-1m-context-now-with-concurrency/374846) reports **60–67 tokens/s on coding tasks and about 40 tokens/s on mixed content**, using two networked 128GB systems. These are developer measurements for a specific deployment, not a matched comparison with the Mac checkpoint or a universal 60+ tokens/s result. A single Spark has lower capacity and bandwidth, and large Flash deployments require more aggressive compression. Dual-machine operation also adds networking, sharding, and configuration work.
* * *
### What Is Measured and What Is Projected
To keep the technical arguments transparent, this analysis separates data into three distinct tiers:
1. **Official Specifications:** Apple-reported hardware metrics (1.2 TB/s bandwidth, UltraFusion 4-die MCM packaging) and NVIDIA published architecture data.
2. **Reported Developer Benchmarks:** Public developer logs from Hugging Face model cards, GitHub project repositories, and technical forums. These reflect specific checkpoints, quantizations, and runtimes; they serve as empirical reference points rather than universal baselines.
3. **Mathematical Projections:** Bandwidth-scaling models and Roofline estimations. Projections are sensitive to assumptions regarding memory bus efficiency and speculative draft acceptance rates.
_Evaluation targets: **30 / 60 / 100 committed tokens/s** correspond to approximately **33.3 / 16.7 / 10 milliseconds per output token**, or **33.3 / 16.7 / 10 seconds for 1,000 output tokens**, excluding prefill. The central comparison uses 60 tokens/s as a chosen target, not a universal usability threshold. Time to first token, output quality, and sustained agent behavior matter separately._
* * *
## 1\. The Local Inference Rationale: Autonomy and Control
Investing in dedicated local inference hardware is rarely justified solely by comparing token costs against cloud API pricing. For developers and researchers, the primary returns on investment center on operational control:
- **Data Sovereignty:** Processing proprietary codebases, confidential research notes, and private document archives entirely on-device without exposing data to external gateways.
- **Model Version Control and Customization:** Pinning exact checkpoint versions, avoiding upstream behavioral drifts or sudden policy changes, and running specialized community fine-tunes.
- **Dedicated Infrastructure:** Treating local inference as persistent background compute for personal automation, local RAG indexing, and agentic workflows.
When these requirements warrant a dedicated workstation, hardware physics determine which configurations can realistically deliver an interactive experience.
* * *
## 2\. Memory Architecture & The MoE Decoupling
Mixture-of-Experts (MoE) architectures decouple two variables that are strictly tied together in dense models: **total parameter footprint** (how much memory is required to store the model) and **active parameter footprint** (how much weight data must be streamed to generate a single token).
| Target Category | Representative Model Tier | Total Parameters ($P_{\text{total}}$) | Active Parameters / Token ($P_{\text{active}}$) |
| --- | --- | --- | --- |
| **Efficient / High-Throughput** | DeepSeek-V4-Flash | ~284B | ~13B |
| **Flagship Capability** | GLM-5.3 Tier | ~744B | ~40B |
_Parameter totals may differ across official architecture labels, serialized tensor counts, and runtime scanners. For example, the Flash conversion card reports ~305B tensors and the GLM-5.3 GGUF listing reports ~754B parameters. Active-parameter figures are approximate architecture-level values, not exact per-token traffic measurements; auxiliary/MTP tensors and counting conventions must be checked separately._
### Physical Memory vs. Runtime Allocations
A model’s raw weight size is only the baseline. A complete deployment must satisfy the full memory constraint:
$$
M_{\text{Weights}} + M_{\text{KV-Cache}} + M_{\text{Runtime}} + M_{\text{Draft-Model}} + M_{\text{OS}} \le M_{\text{Physical}}
$$
| Hardware Platform | Physical Installed Memory | Peak Nominal Bandwidth | Memory & Interconnect Topology |
| --- | --- | --- | --- |
| **M5 Ultra (256GB)** | 256 GB | 1,200 GB/s | Single-system UMA via UltraFusion (4-die MCM) |
| **M5 Ultra (512GB)** | 512 GB | 1,200 GB/s | Single-system UMA via UltraFusion (4-die MCM, 80-core GPU) |
| **Single DGX Spark** | 128 GB | 273 GB/s | Single-system unified LPDDR5x |
| **Dual DGX Spark** | 256 GB (2 × 128GB) | 2 × 273 GB/s | Distributed two-node cluster via network interconnect |
- **DeepSeek-V4-Flash (MXFP4/MXFP8 hybrid, ~167 GB):** The referenced checkpoint enters the 256GB capacity range without additional sub-4-bit compression. Usable context depth still depends on runtime cache formats and OS overhead.
- **GLM-5.3 (UD-IQ4\_XS, ~365 GB):** This checkpoint requires the 512GB capacity tier in this comparison; long context also requires room for runtime buffers and KV-cache expansion.
**FIGURE 01 / CAPACITY: Model Weight Size and Memory Capacity**
Memory capacity expands checkpoint choice; it does not establish generation speed.
Model Weight Size and Memory Capacity — GB · weight size (approximate)
| Scenario | Weight size |
| --- | --- |
| DeepSeek-V4-Flash(MXFP4/MXFP8 hybrid) | 167 |
| GLM-5.3(UD-IQ4\_XS) | 365 |
Reference lines: 128GB: 128 GB · weight size (approximate); 256GB: 256 GB · weight size (approximate); 512GB: 512 GB · weight size (approximate).
Dual DGX Spark: 2 × 128GB, distributed. Two networked nodes, not one continuous unified memory pool.
- Weight size only; runtime, KV cache, draft components, and system memory must also fit.
- Reference lines show installed capacity. Unfilled space is not a context-memory guarantee.
Source: QIANHE CHEN · LOCAL LLM HARDWARE ANALYSIS · SEPTEMBER 8, 2026
The GLM-5.3 quantization files make the capacity boundary concrete:
| GGUF Variant | Approximate File Size | Implication for 512GB |
| --- | --- | --- |
| UD-IQ4\_XS | 365GB | Enters the capacity range; runtime and context must also fit |
| UD-Q4\_K\_XL | 467GB | Nominally below capacity, with tight runtime and system headroom |
| UD-Q5\_K\_XL | 562GB | Exceeds installed memory before runtime allocations |
| UD-Q6\_K\_XL | 684GB | Exceeds installed memory |
| Q8\_0 | 801GB | Exceeds installed memory |
These are file sizes, not measured resident-memory requirements or quality rankings. [Unsloth GLM-5.3 GGUF files](https://huggingface.co/unsloth/GLM-5.3-GGUF).
Both M5 Ultra GPU tiers retain 1.2TB/s bandwidth. Spark’s **2 × 273GB/s** describes two local buses, not a continuous, lossless 546GB/s bus. Distributed performance depends on sharding, network transfers, collectives, and synchronization. [Apple specifications](https://www.apple.com/mac-studio/specs/); [NVIDIA DGX Spark specifications](https://www.nvidia.com/en-us/products/workstations/dgx-spark/).
* * *
## 3\. Decoding Physics: The Bandwidth Budget
For low-batch autoregressive decoding, a Roofline-style lower bound separates memory transfer from compute:
$$
t_{\text{step}} \gtrsim \max\left( \frac{D_{\text{step}}}{BW_{\text{effective}}}, \frac{F_{\text{step}}}{C_{\text{effective}}} \right)
$$
Here $D_{\text{step}}$ is data moved, $F_{\text{step}}$ is compute volume, and the denominators are realized bandwidth and compute throughput. Dependencies, synchronization, and other overhead can increase execution time. For vanilla decoding, one forward commits one token; this equivalence does not apply to speculative verification.
### Weight Traffic and Full Implementation Traffic
With uniform 4-bit active weights, the simplified weight-reading estimates are:
$$
D_{\text{Flash weights}} \approx 13\text{B}\times 0.5\text{ B}=6.5\text{ GB/forward}
$$
$$
D_{\text{flagship weights}} \approx 40\text{B}\times 0.5\text{ B}=20\text{ GB/forward}
$$
At 60 forwards/s, these require **390GB/s** and **1,200GB/s** respectively. For 40B active parameters at an average 4.5 bits, the estimate rises to **22.5GB/forward**, or **1,350GB/s at 60 tokens/s**. These estimates assume each active weight is read once and exclude other traffic. The gap to nominal bandwidth is not confirmed performance headroom.
Full implementation traffic belongs in the main budget. The **ds4-on-Spark developer estimates about 11GB per vanilla token**, including routed experts, dense layers, attention-related work, and KV reads, with roughly **±20% uncertainty**. This is a specific aggressively quantized Spark implementation. It is neither a measurement of the Mac MXFP4/MXFP8 checkpoint nor simply 6.5GB plus a transferable overhead allowance. [Developer roofline accounting](https://github.com/Entrpi/ds4-on-spark/blob/main/README.md).
| Traffic Assumption | GB / Committed Token | 30 tokens/s | 60 tokens/s | 100 tokens/s |
| --- | --- | --- | --- | --- |
| 13B active, uniform 4-bit weights only | 6.5 | 195GB/s | 390GB/s | 650GB/s |
| Specific ds4-on-Spark full-traffic estimate | ~11 | ~330GB/s | ~660GB/s | ~1,100GB/s |
| 40B active, uniform 4-bit weights only | 20 | 600GB/s | 1,200GB/s | 2,000GB/s |
| 40B active, average 4.5-bit weights only | 22.5 | 675GB/s | 1,350GB/s | 2,250GB/s |
**All rows assume one forward per committed token.** The 11GB row is a separate implementation scenario; the others are simplified weight-only scenarios. Multiplying its traffic estimate by a target rate does not predict Spark or Mac inference speed.
**FIGURE 02 / BANDWIDTH BUDGET: Decode Bandwidth Budget at 60 Tokens/s**
One forward per committed token. Estimates, not measured inference speed.
Decode Bandwidth Budget at 60 Tokens/s — GB/s · required memory bandwidth
| Scenario | Traffic at 60 committed tokens/s |
| --- | --- |
| 13B active parameters(4-bit) | 390 |
| ds4-on-Spark full traffic(~11 GB/token estimate) | 660 |
| 40B active parameters(4-bit) | 1,200 |
| 40B active parameters(4.5-bit) | 1,350 |
Reference lines: M5 Ultra nominal: 1,200 GB/s: 1,200 GB/s · required memory bandwidth.
- 13B / 40B rows: uniform active-weight bits only; other runtime traffic is excluded.
- 11 GB/token: separate Spark implementation estimate (±20%); not a Mac measurement.
- Source: Entrpi/ds4-on-spark. Distance to nominal is not confirmed performance headroom.
Source: QIANHE CHEN · LOCAL LLM HARDWARE ANALYSIS · SEPTEMBER 8, 2026
The 13B-active weight-only scenario leaves theoretical room at 60 tokens/s, but a full runtime budget still needs measurement. At 100 tokens/s, the illustrative 11GB traffic scenario already requires about 92% of a 1.2TB/s bus. The 40B scenarios exceed nominal bandwidth at 100 tokens/s even before other traffic. Increasing committed tokens per verification is therefore a central route to higher throughput under these assumptions.
### A Separate Model for Speculative Decoding
A draft proposes tokens, and the target verifies them. Let $A$ be the number of output tokens actually committed per cycle, including any correction or bonus token. A long-run approximation is:
$$
TPS_{\text{committed}} \approx \frac{E[A]}{E[t_{\text{draft}}+t_{\text{verify}}+t_{\text{misc}}]}
$$
$$
D_{\text{per committed token}} \approx \frac{E[D_{\text{verify}}+D_{\text{draft}}]}{E[A]}
$$
The traffic expression omits miscellaneous memory operations, which must be added for a complete budget. Acceptance length, draft cost, verification cost, and content predictability all matter. Verification processes several candidate positions and can reuse weights, but its compute and attention costs are not necessarily those of a single-token forward. More draft depth does not guarantee more speed.
Model-native speculation is available in **selected checkpoint/runtime combinations**. For the referenced Flash build, the [model card](https://huggingface.co/Vontra/DeepSeek-V4-Flash-0731-MXFP4-MLX) specifies embedded MTP tensors, oMLX 0.5.4rc2 or later, and explicit `mtp_enabled` configuration. This does not establish support for arbitrary MLX/GGUF conversions or other MoE architectures.
Figure 2 budgets vanilla traffic. Figure 3 scales an already measured DSpark committed-token baseline under fixed workload assumptions. Its points do not follow directly from the weight-only multiplication in Figure 2.
* * *
## 4\. Empirical Benchmarks and Bandwidth Projections
### Reported Reference Benchmarks
These are reference points across different checkpoints, quantizations, engines, and prompts. **They do not establish a platform ranking at equal model quality.**
| Hardware / Source | Checkpoint and Conditions | Reported Single-Request Decode | Quality / Fidelity Evidence |
| --- | --- | --- | --- |
| **M3 Ultra 256GB, 80-core GPU** · [model card](https://huggingface.co/Vontra/DeepSeek-V4-Flash-0731-MXFP4-MLX) | Flash-0731 MXFP4/MXFP8; oMLX 0.5.4rc2; 23K cached context | 26.1 t/s vanilla; 41.7 t/s native DSpark | Conversion reports bit-identical weights; this does not establish cross-quantization task equivalence |
| **Single DGX Spark** · [ds4-on-Spark README](https://github.com/Entrpi/ds4-on-spark/blob/main/README.md) | Flash with ~2-bit expert mix; versioned developer tests | Plain decode: 20 t/s at 2K, 17.7 at 48K; an earlier speculative suite averaged 27.7 t/s | Aggressive compression; matched quality against the Mac checkpoint is not established here |
| **Dual DGX Spark** · [original forum report](https://forums.developer.nvidia.com/t/deepseek-v4-flash-dspark-on-2x-dgx-spark-gb10-big-single-stream-speed-boost-60-67-tok-s-1m-context-now-with-concurrency/374846) | Flash DSpark; TP=2; warmed, thinking off; recipe-specific weights and KV format | 60–67 t/s coding; ~40 t/s mixed content | Different recipe and task mix; no matched quality comparison supplied here |
The single-Spark entries come from different versioned tests, so their ratio is not a controlled speculation speedup. Likewise, later dual-Spark recipes should be treated as separate records rather than silently replacing this report’s conditions. Historical **GLM-5 Q4** results cannot validate GLM-5.3; a comparable GLM-5.3 measurement remains an evidence gap.
The M3 benchmark uses output-length slopes to cancel prefill. It measures decode at cached context, not request-to-first-token latency. Full model perplexity is not published in the cited conversion card. Bit-exact format conversion preserves source weight values; it does not demonstrate that native MXFP4, a ~2-bit expert mix, and IQ4\_XS deliver equivalent capabilities.
### Bandwidth Scaling Sensitivity Scenarios
The M3 Ultra test platform operated on an 819 GB/s bus, whereas the M5 Ultra provides 1,200 GB/s, giving a theoretical bandwidth multiplier of:
$$
r = \frac{1,200}{819} \approx 1.465
$$
To evaluate how generation speed scales if only memory bandwidth increases, let $f$ represent the hypothetical proportion of per-step execution time that scales directly with memory bandwidth:
$$
R_{\text{new}} = \frac{R_{\text{old}}}{(1 - f) + f / r}
$$
**FIGURE 03 / CONDITIONAL PROJECTIONS: Bandwidth-Only Decode Projections**
Scenario analysis — not measured M5 Ultra results.
Bandwidth-Only Decode Projections — tokens/s · projected generation speed
| Scenario | Vanilla decoding | DSpark |
| --- | --- | --- |
| f = 0.50 | 31.0 | 49.6 |
| f = 0.80 | 35.0 | 55.9 |
| f = 1.00 | 38.2 | 61.1 |
Reference lines: Target: 60 t/s: 60.0 tokens/s · projected generation speed.
- f = assumed share of step time that scales with bandwidth. Scenarios are not confidence intervals.
- M3 Ultra baselines: 26.1 t/s vanilla; 41.7 t/s DSpark. Bandwidth ratio: 1,200 / 819 ≈ 1.465.
- Bandwidth-only scaling excludes architectural, cache, and kernel improvements.
Source: QIANHE CHEN · LOCAL LLM HARDWARE ANALYSIS · SEPTEMBER 8, 2026
_These scenarios represent mathematical sensitivity models, not measured hardware limits. They isolate bandwidth scaling and do not account for architectural IPC improvements, larger caches, or kernel-level enhancements._
### Interpretation and Limits
For $f=0.5$ and $f=0.8$, the DSpark baseline projects to **49.6 and 55.9 tokens/s**; fully bandwidth-scaling execution gives **61.1 tokens/s**. Vanilla projects to **31.0 / 35.0 / 38.2 tokens/s**. These are scenarios, not confidence intervals, measured M5 results, or a claim that every workload will fall inside the range.
Applying the same scaling formula to DSpark assumes an unchanged acceptance distribution, draft configuration, and workload. It does not separately predict how M5 changes draft and verification costs. Additional GPU compute, Neural Accelerators, cache behavior, and kernels may change results, but no uplift is assigned here without measurements. The dual-Spark coding/mixed-content difference reinforces why acceptance and task mix must be recorded.
### A Common Benchmark and Quality Protocol
A purchasing comparison should publish reproducible configuration records and evaluate speed alongside retained capability:
| Dimension | Required Controls or Measurements |
| --- | --- |
| Model identity | Exact model revision, conversion revision, quantization per tensor group, retained experts, and auxiliary/MTP tensors |
| Execution | Engine commit, kernels, OS/drivers, power mode, sharding, cache formats, and networking configuration |
| Workload | Same prompts, existing context, output length, temperature, sampling settings, seed where applicable, and thinking mode |
| Speculation | On/off runs, draft depth, accepted/committed tokens per cycle, draft time, verification time, and rollback overhead |
| Counting | Count committed output tokens, not speculative steps or proposed tokens; separate single-stream from aggregate throughput |
| Quality | Perplexity delta plus coding, agent, tool-calling, and long-context retrieval evaluations against the source checkpoint |
| Stability | Repeated sustained runs with thermal state, failures, output correctness, and run-to-run variation reported |
A fast compressed checkpoint is useful only if it retains the capabilities the buyer needs. Missing quality measurements should remain explicitly unknown rather than being replaced by assumptions based on nominal bit width.
### End-to-End Experience: TTFT, Prefill, and Agents
Decode speed is only one part of interaction latency. A retail evaluation should report cold model-loading time, cold and warm **time to first token (TTFT)**, and prompt processing at **4K, 32K, and 128K** context where supported. Unsupported context lengths should be recorded as such. Test prefix-cache hits, cache misses, and small context changes after tool responses separately.
For coding agents, run **20–50 consecutive turns** on representative repositories and measure **2K–8K sustained output** alongside total task duration and success. This captures cache behavior, memory growth, and stalls that short decode bursts miss. The 80-core GPU could matter more for prefill, multi-token verification, batching, training, or diffusion than for fully memory-bound vanilla decode; that is a hypothesis to test, not a guaranteed gain.
* * *
## 5\. Pricing and Configuration Choices
**Pricing for the 256GB configurations is now confirmed, while pricing for the 512GB option remains unavailable.** The US Apple Store lists **36-core CPU / 80-core GPU / 256GB / 1TB at USD 10,799**. The 256GB memory upgrade adds **USD 4,000** to the corresponding 96GB configuration. The 512GB option is scheduled for late October. Prices below are US hardware prices before tax; storage, networking, and regional pricing affect the final cost. [Apple Store configuration](https://www.apple.com/shop/buy-mac/mac-studio/m5-ultra-chip-36-core-cpu-80-core-gpu-256gb-memory-1tb-storage); [availability announcement](https://www.apple.com/newsroom/2026/08/apple-introduces-new-mac-studio-with-m5-max-and-m5-ultra/).
| Configuration | US Hardware Price | Bandwidth | Buying Question |
| --- | --- | --- | --- |
| M5 Ultra, 30C CPU / 64C GPU / 256GB / 1TB | USD 9,499 | 1.2TB/s | Does the lower-cost GPU tier satisfy your decode and latency requirements? |
| M5 Ultra, 36C CPU / 80C GPU / 256GB / 1TB | USD 10,799 | 1.2TB/s | Does prefill, verification, or other compute-heavy work justify the USD 1,300 premium? |
| M5 Ultra, 36C CPU / 80C GPU / 512GB | Unavailable | 1.2TB/s | Is a larger checkpoint essential, with adequate runtime headroom? |
| Single DGX Spark, 128GB | USD 4,699 | 273GB/s | Can smaller or more compressed checkpoints meet your quality needs? |
| Dual DGX Spark, 2 × 128GB | USD 9,398 subtotal | 2 × 273GB/s, distributed | Does CUDA compatibility justify the network and operational overhead? |
At **USD 9,499**, the [64-core M5 Ultra 256GB](https://www.apple.com/shop/buy-mac/mac-studio/m5-ultra-chip-30-core-cpu-64-core-gpu-256gb-memory-1tb-storage) costs just **USD 101 more** than two DGX Spark units at their [combined MSRP](https://forums.developer.nvidia.com/t/2-23-2026-price-change-announcement/361713) of **USD 9,398**, before tax and Spark interconnect costs. The dual subtotal is not a bundle quote, and similar hardware prices do not imply equivalent model quality or performance.
The 80-core GPU has 25% more GPU cores than the 64-core configuration, but **both have the same nominal memory bandwidth**. A fully memory-bound single-token workload should not be assumed to gain 25% throughput. Compute-heavy gains depend on kernel support and utilization. The Mac prices also cannot be evaluated against dual Spark on speed alone when checkpoint fidelity and test conditions differ.
### Runtime Maturity Is a Purchase Criterion
Capacity does not establish architecture support, efficient Metal/CUDA kernels, correct MTP loading, optimized sparse/linear attention, stable KV caches, or output parity. The documented Flash/oMLX path is specific evidence for one combination. Its maturity does not transfer automatically to GLM-5.3 or future models. Before buying for a particular checkpoint, confirm that its intended runtime can load it, execute it correctly, and sustain your context and workload on the intended hardware.
### Distributed Alternatives on Both Platforms
Apple also supports multiple Macs connected through Thunderbolt 5 and RDMA. Its [launch announcement](https://www.apple.com/newsroom/2026/08/apple-introduces-new-mac-studio-with-m5-max-and-m5-ultra/) claims up to **3× inference performance with four Mac Studio systems** in its selected test. This is vendor evidence for a distributed workload, not a GLM-5.3 single-stream benchmark or proof of cost efficiency.
Both multi-Mac and dual-Spark deployments require compatible runtimes and effective model partitioning. Spark’s ConnectX-7 networking and Mac’s Thunderbolt links connect separate physical memory domains; neither makes remote memory equivalent to local bandwidth. Account for collectives, layer synchronization, topology, and orchestration when measuring scale-out gains.
* * *
## Purchasing Decision Matrix
| Configuration | Conditional Primary Fit | Runtime Maturity / Software Risk | Evidence Needed Before Purchase |
| --- | --- | --- | --- |
| **M5 Ultra 30C / 64C / 256GB** | Flash-class capacity and price priority; vanilla decode candidate | Flash has a documented oMLX path; retail M5 kernels and behavior need validation | Same-checkpoint decode, TTFT, context fit, quality, and sustained agent runs |
| **M5 Ultra 36C / 80C / 256GB** | Prefill, MTP verification, batching, and other compute-heavy work | Extra compute helps only where the runtime uses it | Controlled 64-core/80-core comparison; no assumed 25% decode gain |
| **M5 Ultra 36C / 80C / 512GB** | Larger checkpoints and selected 4-bit GLM-5.3 variants | Capacity fit alone does not establish efficient architecture/kernel support | Runtime memory at target context, retained quality, speed, and final price |
| **Dual DGX Spark** | CUDA workflows and predictable coding workloads | Recipe-specific DSpark support plus multi-node setup and maintenance | Matched checkpoint quality, acceptance, TTFT, and mixed-content throughput |
| **Single DGX Spark** | Lower entry cost, smaller models, or acceptable aggressive compression | Large Flash deployments depend on specialized quantization and engines | Task quality after compression and sustained latency at usable context |
* * *
**256GB remains the performance-balanced candidate on paper; 512GB is the capacity-oriented choice.** Neither is a definitive recommendation before retail testing. Separate the two 256GB GPU tiers, compare retained model quality as well as throughput, and validate vanilla decode, speculative decode, TTFT, long-context behavior, and sustained agent workloads. The right purchase is the configuration that meets those requirements at an acceptable total cost.
---
## Software's Ultimate Rival Isn't a Competitor — It's the User's Own Agent
URL: https://www.qianhechen.com/blog/software-ultimate-rival-user-agent/
How AI agents are reshaping software pricing, open-source leverage, and long-tail apps by letting users build tailored alternatives on demand.

TECH OBSERVATION
# Software's Ultimate Rival Isn't a Competitor — It's the User's Own Agent
Jun 09, 2026 [ai](https://www.qianhechen.com/blog/tags/ai/) [agent](https://www.qianhechen.com/blog/tags/agent/) [codex](https://www.qianhechen.com/blog/tags/codex/) [software-market](https://www.qianhechen.com/blog/tags/software-market/) [open-source](https://www.qianhechen.com/blog/tags/open-source/) [macos](https://www.qianhechen.com/blog/tags/macos/) [tech-business](https://www.qianhechen.com/blog/tags/tech-business/)
**Introduction:** For decades, the software market has operated on a quiet consensus: if a user needs a specific capability, they buy a license or a subscription. But with the mainstreaming of advanced LLMs like GPT-5.5 and Codex, this foundational premise is rapidly unraveling.
The most urgent question facing software companies today is no longer about positioning against competitors. It is this: **Why should a user pay for off-the-shelf, bug-prone commercial software when they can pay an AI provider the same amount to conjure a bespoke version perfectly tailored to their workflow?**
This might sound like AI-boom hubris, but it is already the default decision matrix for a growing cohort of power users. The privilege of software creation is descending from corporations, engineering teams, and open-source maintainers directly into the hands of the “hardcore user”.
This decentralization of power is destroying three core assumptions of the SaaS and software market:
1. **Tolerance for friction** is falling off a cliff.
2. **Pricing anchors** are shifting from “feature lists” to “the cost of generating an alternative”.
3. **Shallow technical implementations and “naked ideas”** are facing hyper-deflation.
Software isn’t dying, but it is permanently losing its default pricing power.
* * *
## 1\. From Reluctant Tolerance to Ruthless Judgment
In the past, when an app crashed, stuttered, or behaved in counter-intuitive ways, users largely just tolerated it.
This wasn’t out of patience; it was out of powerlessness. You didn’t have the source code, you didn’t know how to compile, and you certainly didn’t understand the intricacies of system permissions or memory leaks. Your only recourse was to reboot, send an email into a void of support tickets, or jump ship to an equally flawed competitor.
**AI Agents have handed users the “right of software disposal”.**
My personal tipping point happened in early 2026. I became a heavy user of Codex—burning through over 10 billion tokens in May alone. Behind that staggering number is a fundamental psychological shift: **I developed a visceral intolerance for the commercial software I was paying for.**
Six months ago, I spent $50 on a highly popular, well-reviewed Mac productivity app. Yet, twice a week, I encountered hard crashes. Historically, I would have grit my teeth. Rewriting a native macOS arm64 app using AppKit was simply beyond my purview.
But I stopped compromising. I uninstalled the $50 app and, guided by Codex, built a 1-to-1 functional clone from scratch. From architectural design and code generation to debugging and performance optimization, the Agent did the heavy lifting. The result wasn’t a fragile demo; it is a stable, high-performance daily driver.
The profound shock here isn’t just “AI wrote code for me”. It is that **my entire lens for evaluating software has shifted.**
When an application stutters or fails now, my first thought is no longer, _“When will the devs patch this?”_ It is, _“Why don’t I just build my own?”_
This is the existential threat to commercial software. Not every user will become a developer. But the most demanding, vocal, and influential power users—the ones who dictate community sentiment—are no longer willing to wait on a vendor’s roadmap.
## 2\. The Collapse of the Pricing Anchor
How was software priced historically? On the surface: by seats, storage limits, tiers, and syncing capabilities. But fundamentally, **software companies sold a packaged “boundary of capability”.** If you wanted the utility, you had to swallow the price tag, the bugs, the sluggish update cycles, and the arrogant limitations.
Agents have shattered this calculus. The user’s A/B test is no longer _Software A vs. Software B_. It is: **The cost of an off-the-shelf license vs. The cost of prompting an Agent to achieve the same outcome.**
The latter is a radically new cost structure: Token usage + human oversight time + local deployment effort. And as models improve, this cost is trending aggressively toward zero.
In the past, $50 felt reasonable for an app because the feature "existed". Today, if a$ 50 app crashes twice a week, the user recalculates: _If I already pay for an AI subscription that can read code, debug, and compile, what exactly is this $50 buying me?_
**The pricing anchor has migrated.** Users are no longer paying for access to a “feature black box”; they are paying for a **reliable outcome**. If your software simply offers a function but fails to be stable, fast, customizable, or respectful of the user’s workflow, its commercial premium will evaporate. You are no longer competing with other startups; you are competing with the user’s personal Agent.
## 3\. “Fixability” as a Premium: Open-Source Leverage and the Closed-Source Trap
This shockwave is highly targeted. It will first obliterate a specific breed of product: **software with clear utility, shallow technical moats, premium pricing, and historically poor UX.**
This dynamic is also entirely reshaping the open-source vs. closed-source paradigm.
Take the Logitech mouse ecosystem as an example. The hardware is world-class, but the official control software (G Hub/Options+) is notoriously clunky, particularly when trying to map custom buttons to nested sub-processes within a complex workflow. With closed-source software, this is a dead end.
I abandoned the official app for an open-source alternative. The open-source app had bugs too, but it possessed one advantage that a commercial black box never will: **I had the code.**
In the Agent era, the value of those four words cannot be overstated. Having the code means I can dump the repository into an LLM, ask it to isolate the logic flaw, rewrite the implementation, and compile a fix on the spot. Power users are instantly upgraded from helpless issue-reporters to temporary maintainers.
**“Fixability” is becoming a core product feature.** In the past, commercial closed-source software sold “ease of use”. But if your default experience is flawed and you forbid users from fixing it, your closed ecosystem transforms from an asset into a liability.
## 4\. Zero-Friction Supply for the Long Tail
An even more fascinating shift is happening in the “long-tail” market.
I recently bought a Bluetooth-enabled laptop cooling pad. The manufacturer only provided a Windows control app. This is a classic software market failure: the vendor deems the Mac user base too small to justify the R&D cost, leaving the user with crippled hardware. The demand exists, but the economics of supply do not.
Agents rewrite the economics of supply. It took me one hour with an Agent to establish the Bluetooth handshake protocols, and within six hours, I had a native, secure, and intuitive Mac control app.
This means **we are about to see an explosion of software that previously made zero commercial sense to build**:
- Mac/Linux drivers for niche hardware.
- Elegant GUI wrappers for obscure command-line tools.
- Hyper-specific automation panels for a three-person team’s internal workflow.
These won’t require venture capital, product managers, or conversion funnels. They will sprout organically from the immediate pain points of individuals. **The future won’t have less software; it will have an exponential abundance of it**, generated with near-zero friction.
## 5\. The Deflation of “Naked Ideas” and the Deepening Tech Moat
You see it daily on tech Twitter and GitHub now: someone launches a clever new product based on a neat idea, and within 48 hours, someone else has used an LLM to build a pixel-perfect, open-source clone. Or, a developer puts a paid GUI on top of a free CLI tool, only to have the GUI cloned and open-sourced immediately.
This isn’t just about developer ethics; it’s a stark demonstration of **the hyper-deflation of ideas.**
Historically, a good idea was protected by the wide moat of execution—designing, coding, testing, and shipping took time and capital. Today, that moat has evaporated. If your idea can be replicated by an Agent in an afternoon, it is not a moat. **Naked ideas are now practically worthless.**
Does this mean technical moats are dead? On the contrary. They are retreating to the deep water.
The shallow engineering wrappers that many SaaS companies charge for will be commoditized. But the premium on truly hard tech will skyrocket. The new defensibility lies in what an Agent _cannot_ easily spin up in a few hours:
- Long-term stability of complex distributed systems.
- Extreme memory optimization and performance rendering.
- Deep integration with low-level hardware protocols.
- The accumulated data edge and edge-case handling learned from years of real-world usage.
- Compliance, liability, and enterprise-grade security.
## Conclusion: Prove Your Existence
The software companies of tomorrow cannot coast on the assumption that users will pay simply because a feature exists.
Every product must rigorously answer a single, unforgiving question: **Why shouldn’t the user just keep their money and have their Agent build this instead?**
When users realize they can generate their own solutions, they haven’t suddenly become cheap. They simply refuse to pay a premium for software that dictates their workflow, crashes without warning, and aggressively resists modification.
Historically, software companies owned the means of production, and users shopped from the shelf. Today, the users own the factory.
The endgame isn’t that commercial software dies. It is that software must finally prove its convenience, stability, and deep expertise are vastly superior to what a user can conjure up on a Tuesday afternoon.
---
## Contact
URL: https://www.qianhechen.com/contact/
Contact Qianhe Chen by email or through professional profiles including LinkedIn, GitHub, Google Scholar, ORCID, and dblp.
# Contact
The best way to reach me is by email. You can also find my research and engineering work through the profiles below.
## Email
[qianhechen01@gmail.com](mailto:qianhechen01@gmail.com)
## Profiles
- [LinkedIn](https://www.linkedin.com/in/qianhechen/)
- [GitHub](https://github.com/chenqianhe)
- [Google Scholar](https://scholar.google.com/citations?user=pwbYRX0AAAAJ)
- [ORCID](https://orcid.org/0000-0001-8291-5789)
- [dblp](https://dblp.org/pid/315/4823.html)
---
## Thinkverse
URL: https://www.qianhechen.com/industry/thinkverse/
My work as Tech Lead & Founding Engineer at Thinkverse spans full-stack development and contributions to AI service design and maintenance for AI-powered math learning.
[Back to Industry](https://www.qianhechen.com/industry/)
Industry
# Thinkverse
My work as Tech Lead & Founding Engineer at Thinkverse spans full-stack development and contributions to AI service design and maintenance for AI-powered math learning.
## Company Information
Legal name
Learnie, Inc.
Role
Tech Lead & Founding Engineer
Also known as
Learnie, Learnie, Inc., Learnie, Inc. dba Thinkverse
Website
[https://www.thinkverse.co/](https://www.thinkverse.co/)
## My Role
I’m Tech Lead & Founding Engineer at Thinkverse. My work spans full-stack development and contributions to the design and maintenance of AI services. I joined the company in August 2023.
## Product Context
Thinkverse is an AI math tutor and teaching assistant for K–12 classrooms. It combines student-facing learning tools with teacher-facing tools for understanding student progress and supporting instruction.
## Engineering Work
My responsibilities include full-stack development across the product and work on the AI services that support the learning experience.
## Public References
The [Thinkverse website](https://www.thinkverse.co/) and [product overview](https://www.thinkverse.co/how-it-works) describe the product and its classroom use cases.
## Resources
- Company website: [https://www.thinkverse.co/](https://www.thinkverse.co/)
- How it works: [https://www.thinkverse.co/how-it-works](https://www.thinkverse.co/how-it-works)
---
## Journey
URL: https://www.qianhechen.com/journey/
Explore 8+ journey entries capturing life's moments through photography and stories. Latest: Milan — Where Fashion Meets History & Wandering Through Venetian Alleyways (Nov 2025). Featuring travel, Milan, Italy, Venice and more personal experiences from around the world.
# Journey
A collection of moments, thoughts, and milestones along the journey.
Nov 11, 2025


### Milan — Where Fashion Meets History
Wandering through Milan's elegant streets, where Gothic spires of the Duomo pierce the sky and haute couture boutiques line the Galleria Vittorio Emanuele II.
travel Milan Italy
Nov 9, 2025





### Wandering Through Venetian Alleyways
Getting lost in the labyrinthine streets of Venice, where every corner reveals a hidden bridge, a quiet canal, or a centuries-old palazzo.
travel Venice Italy
Nov 9, 2025



### Lido Island — Sun, Sea & Cinema
Escaping to Lido Island, the serene barrier island where golden beaches meet the Adriatic Sea — and where the Venice Film Festival brings Hollywood glamour to the lagoon each year.
travel Lido Island Venice Italy
Nov 8, 2025




### First Steps in La Serenissima
Arriving in Venice, the floating city of canals and bridges. Met a new friend, Chunlei, and together we set out to explore the enchanting maze of waterways.
travel Venice Italy
Nov 7, 2025




### VIS 2025 — Presenting in Vienna
Presenting my research on competitive debate analysis at IEEE VIS 2025 in Vienna. An inspiring week of exchanging ideas with the visualization community and catching up with Yong Wang and his students.
vis Vienna Austria
Nov 6, 2025












### Alpine Reflections in Salzkammergut
A day trip through Austria's stunning lake district with friends — mirror-still waters, towering peaks, and charming villages that seem frozen in time.
travel Salzkammergut Austria
Oct 30, 2025








### Bavarian Days in Munich
Exploring Munich's blend of tradition and modernity — from the historic Marienplatz to cozy beer halls. Reunited with my friend Yiwei for an unforgettable few days.
travel Munich Germany
Oct 29, 2025




### Hong Kong — A Brief Layover
A quick stop in Hong Kong before the European adventure begins. Caught up with Xuben amid the neon lights and bustling streets of this vibrant city.
travel Hong Kong China
---
## Privacy Policy
URL: https://www.qianhechen.com/privacy/
Privacy policy for Qianhe Chen's personal homepage, covering analytics, external links, and contact information.
# Privacy Policy
Last updated: May 9, 2026
This is a personal homepage for sharing professional, academic, and project information. It does not provide user accounts, comments, payments, or forms.
## Analytics
This site uses Google Analytics to understand aggregate traffic patterns, such as page views, referrers, device types, and general location information. These analytics help maintain and improve the site.
## Contact
If you contact me by email, I will use the information you provide only to respond to your message.
## External Links
This site links to external services such as LinkedIn, GitHub, Google Scholar, ORCID, dblp, publishers, and project pages. Those services have their own privacy practices.
## Changes
This policy may be updated when the site changes. The latest version will be published on this page.
---
## Conch: Competitive Debate Analysis via Visualizing Clash Points and Hierarchical Strategies
URL: https://www.qianhechen.com/publications/conch/
Conch is a visual analytics approach for competitive debate analysis, centered on clash points and hierarchical debate strategies.
[← Back to Publications](https://www.qianhechen.com/#publications)
Publication - 2025
# Conch: Competitive Debate Analysis via Visualizing Clash Points and Hierarchical Strategies
[Qianhe Chen](https://www.qianhechen.com/), [Yong Wang](https://yong-wang.org/index.html), Yixin Yu, Xiyuan Zhu, and Ran Wang\*.
IEEE Transactions on Visualization and Computer Graphics (Proceedings of IEEE VIS 25). 2025.

## Paper Information
Authors: Qianhe Chen, Yong Wang, Yixin Yu, Xiyuan Zhu, Ran Wang
Venue: IEEE Transactions on Visualization and Computer Graphics (Proceedings of IEEE VIS 25). 2025.
- Paper: [https://doi.org/10.1109/tvcg.2025.3634629](https://doi.org/10.1109/tvcg.2025.3634629)
- Page: [https://debate.datavizu.app/](https://debate.datavizu.app/)
- Arxiv: [https://arxiv.org/abs/2507.14482](https://arxiv.org/abs/2507.14482)
- Video: [https://youtu.be/kTC33Ta6W2A](https://youtu.be/kTC33Ta6W2A)
## Summary
Conch is an interactive visualization system for post-hoc competitive debate analysis. It turns videos and transcripts into a hierarchy of blocks, clash points, disagreements, viewpoints, argumentative paths, and refutation strategies, then presents them through a multi-spiral process view, an augmented stacked-bar strategy view, and a detailed content view. The work is motivated by interviews with debaters, coaches, and experts, and is evaluated with two expert case studies plus a controlled user study against video and transcript review. The main evidence is that users completed equivalent tasks faster and reported a more learning-supportive cognitive-load profile, while expert validation reported high precision for the automatic structuring pipeline.
## Why This Paper Matters
The paper addresses this question: How can an interactive visualization system help debaters and coaches reconstruct what was debated, how arguments interacted, and which refutation strategies were used across a competitive debate?
It is especially relevant to:
- Post-competition review by debate teams that need to reconstruct how clash points evolved and which arguments were defended, dropped, or modified across sessions.
- Coach-led strategy training, especially when comparing how opposing sides use refutation through evidence, reasoning, agreement, or other tactics over time.
- Instruction for novice debaters, where the hierarchy of clash points, disagreements, viewpoints, and strategies can serve as a scaffold for learning how competitive debates are organized.
## Key Contributions
- Introduces Conch as an interactive system for hierarchical competitive debate analysis, helping debaters and coaches move beyond isolated claims toward clash points, disagreements, viewpoints, paths, and strategies.
- Defines a debate analysis hierarchy that links clash points to disagreements, viewpoints, and block-level paths, making long-range argumentative connections easier to inspect.
- Designs a compact parallel Archimedean spiral Process View that combines chronological session structure with clash-point interactions, reducing the clutter that would arise in a linear debate timeline.
- Designs an augmented stacked-bar Strategy View that compares refutation strategies within and across sessions while also exposing co-occurring tactics.
- Evaluates the system through two expert case studies and a controlled user study, providing evidence that Conch can speed up debate analysis and support more productive learning effort.
## Method
1. Elicit domain requirements from debate practitioners: The authors worked with debaters, coaches, and experts to identify the central analysis tasks: following debate evolution across sessions, identifying clash points and strategies, inspecting disagreement-level interactions, and reading original text details.
2. Prepare debate data and segment it into analysis units: The workflow collects debates from multiple competitions, transcribes and corrects video audio, annotates debate roles and sessions, and segments the transcript into blocks that serve as the basic content units.
3. Construct a hierarchical debate representation: The system combines a strategy framework with a content hierarchy of clash points, disagreements, viewpoints, and paths. Expert validation checks both strategy labels and the distribution of clash points or disagreements to blocks.
4. Visualize temporal clash-point evolution: The Process View maps sessions to parallel Archimedean spiral segments, encodes clash-point distributions and blocks around the spirals, and uses an internal chord diagram to reveal interaction paths across sessions.
5. Visualize strategies and original content: The Strategy View compares strategy usage and co-occurrence through augmented stacked bars, while the Content View lets users inspect the underlying block text and linked strategy annotations.
6. Evaluate with expert case studies and a controlled user study: The evaluation uses two expert-led case studies and a user study comparing Conch against video and transcript review on debate-analysis tasks, time, cognitive load, and user ratings.
## Evaluation and Findings
The evaluation uses ICDI debate used in the controlled user study with 27 debaters and coaches.
Conch averaged 51.1 minutes with all groups completing the tasks.
The evaluation is primarily qualitative, so the findings should be read with these caveats in mind:
- Video review averaged 76.1 minutes and transcript review averaged 94.4 minutes.
- The paper reports 32.8% less time than video review and 45.9% less time than transcript review, with both differences significant at p < 0.01.
- In the controlled user study, all groups completed the debate-analysis tasks, but participants using Conch finished faster: 51.1 minutes on average versus 76.1 minutes for video review and 94.4 minutes for transcript review.
- The cognitive-load results suggest that Conch did not make the task intrinsically easier, but it lowered extraneous load compared with transcript review and increased germane load compared with both video and text conditions.
- The expert case studies show the system’s intended analytic use: experts used the Process View and Strategy View to identify dominant clash points, uneven participation in disagreements, limited direct confrontation, and contrasting strategy patterns between debate sides.
- The automatic structuring pipeline achieved high expert-validated precision for block segmentation, strategy identification, and clash-point or disagreement distribution, supporting the reliability of the extracted hierarchy used by the visual interface.
- User feedback was positive overall, especially for effectiveness and usability, but the visual design and interaction were not uniformly easy to understand because the system combines several novel visual components.
## Applications
This paper is most useful for:
- Debaters and coaches conducting post-competition review: The system is designed around reconstructing debate evolution, clash points, interactions, and strategy use from long records.
- Debate instructors and teams training novice debaters: The paper reports that beginners could use the system as a guide to core debate elements, while experts used it to make analysis more efficient.
- Visualization and discourse-analysis researchers: The paper contributes a combination of hierarchical argumentative abstraction, spiral temporal visualization, and strategy co-occurrence visualization for sequential debate text.
It is less suitable for:
- Speaker-level performance assessment: The system does not currently show the performance of each individual debater, such as contribution volume or argumentative efficiency.
- High-stakes fully automatic adjudication: The authors caution that current language models can still make structured-output mistakes in long-context or reasoning-heavy cases.
## Limitations
- Conch does not currently provide speaker-level performance analysis; its focus is logical and structural debate content rather than individual debater metrics.
- The automatic structuring pipeline may still produce mistakes when context windows or reasoning demands exceed the capabilities of current language models.
- The interface has a learning curve because it combines several coordinated views and novel visual encodings; Q5 and Q9 received relatively lower ratings.
- The compact curved layout improves space use but can make some text difficult to read, so the system relies on hover popups for full content.
- The controlled user study used ICDI data as the experimental material, so broader generalization across every debate language, format, and tournament setting requires further evidence.
## Frequently Asked Questions
What is the main idea of Conch?
Conch turns competitive debate records into a structured hierarchy of blocks, clash points, disagreements, viewpoints, paths, and refutation strategies, then visualizes their evolution and interaction across debate sessions.
What problem does the paper address?
It addresses the difficulty of manually reviewing long debate videos or transcripts, where important disagreements, strategic responses, and long-range argument connections are hard to reconstruct from raw text alone.
How does Conch differ from a transcript or ordinary timeline?
Rather than presenting debate content only in sequence, Conch links session structure with clash-point paths and strategy use. The spiral view emphasizes temporal evolution and interactions, while the strategy view compares tactic patterns between sides.
What evidence does the paper provide?
The paper reports two expert case studies and a controlled user study with debaters and coaches. Conch users completed analysis tasks faster than video or transcript users and showed higher germane load, suggesting more learning-oriented effort.
What limitations should readers keep in mind?
Conch focuses on logical and structural debate content rather than individual speaker performance. The pipeline may still make errors in difficult long-context cases, and the interface requires some learning because it introduces multiple coordinated visual designs.
---
## JobViz: Skill-driven visual exploration of job advertisements
URL: https://www.qianhechen.com/publications/jobviz/
JobViz supports skill-driven visual exploration of job advertisements, helping users inspect relationships between skills, job postings, and labor market demand.
[← Back to Publications](https://www.qianhechen.com/#publications)
Publication - 2024
# JobViz: Skill-driven visual exploration of job advertisements
Ran Wang, [Qianhe Chen](https://www.qianhechen.com/), [Yong Wang](https://yong-wang.org/index.html)\*, Lewei Xiong, and Boyang Shen.
Visual Informatics. Volume 8, Issue 3, September 2024, Pages 18-28.

## Paper Information
Authors: Ran Wang, Qianhe Chen, Yong Wang, Lewei Xiong, Boyang Shen
Venue: Visual Informatics. Volume 8, Issue 3, September 2024, Pages 18-28.
- Paper: [https://doi.org/10.1016/j.visinf.2024.07.001](https://doi.org/10.1016/j.visinf.2024.07.001)
- Project: [https://jobviz.datavizu.app/](https://jobviz.datavizu.app/)
- GitHub: [https://github.com/DataVizU/augmented-radar-chart](https://github.com/DataVizU/augmented-radar-chart)
## Summary
JobViz is a skill-driven visual analytics system for exploring online job advertisements. The paper addresses the gap between large recruitment portals and job seekers’ need to reason about skill requirements, similar positions, and practical job properties together. It processes 2.43 million computer-related 51Job advertisements, extracts skills into a structured framework, clusters posts by skill vectors, and presents them through coordinated overview, cluster, post map, and detail views. Evidence from two case studies and interviews with 26 users suggests that the approach helps users inspect skill patterns and filter posts more efficiently, while domain transfer, clustering scalability, and skill evaluation standards remain important cautions.
## Why This Paper Matters
The paper addresses this question: How can a visual analytics system help job seekers explore large collections of online job advertisements through required skills, skill similarities, and job properties rather than relying only on basic listing filters?
It is especially relevant to:
- Computer-science job seekers who want to compare job advertisements by skill overlap, salary range, company category, and detailed requirements rather than starting only from job titles.
- University career services and advisors who need to explain market skill structures and help students identify plausible career options based on their abilities.
- Recruitment-interface designers studying how to add skill-centered browsing, similarity-based filtering, and linked visual exploration to job search tools.
## Key Contributions
- The paper reframes job advertisement exploration around skills rather than only job titles or basic filters, which matters because applicants often need to understand which positions match their abilities and which nearby alternatives are available.
- It develops a processing pipeline that converts millions of job requirements into skill categories and normalized skill vectors, making large collections of advertisements comparable through skill structure.
- It introduces a coordinated visual analytics interface with overview, cluster exploration, post map, and detail views, supporting a progressive workflow from market-level patterns to individual job decisions.
- It proposes an augmented radar-chart glyph that combines skill proportions with distribution cues, allowing users to compare job clusters and skill patterns in limited screen space.
- It evaluates the system through two realistic case studies and interviews with 26 target users, giving evidence that the workflow is understandable and useful for the studied computer-science job-seeking scenarios.
## Method
1. Derive job-hunting requirements: The authors interviewed job applicants and domain experts, then distilled four requirements: overview of skill-centered job properties, comparison of skill patterns, comparison of posts with similar skills, and post-level detail inspection.
2. Collect job advertisements and define the skill framework: The study uses computer-related job advertisements collected from 51Job and organizes the analysis with a three-level computer science and engineering skill framework.
3. Extract skill requirements from text: The processing pipeline filters requirement text, classifies requirement sentences, extracts key phrases with JioNLP, and uses manually checked phrase labels to build a skill dictionary.
4. Represent and cluster advertisements by skills: Each advertisement is converted into a normalized skill vector. Pairwise similarity is computed from Euclidean distance, and affinity propagation groups selected posts into clusters without requiring a predefined cluster count.
5. Provide linked visual exploration: The interface combines a skill-job overview, job cluster and post map views, an augmented radar-chart glyph, and a detail table so users can move from market patterns to individual advertisements.
6. Evaluate with case studies and user interviews: The authors demonstrate workflows through two case studies and evaluate the system with 26 users completing five tasks, rating the system, and giving interview feedback.
## Evaluation and Findings
The evaluation uses 26 target users from five universities and four companies, interviewed while using the online JobViz system.
Exploration effectiveness was rated mean 6.28 with standard deviation 0.56; usability was rated mean 6.30 with standard deviation 0.75; visual design and interactions were rated mean 6.29 with standard deviation 0.73. All task instances were completed within 17 minutes, and task averages were under 200 seconds.
The evaluation is primarily qualitative, so the findings should be read with these caveats in mind:
- The study did not include a controlled comparison condition; participant feedback includes qualitative comparison with recruitment websites.
- No numeric performance improvement against existing portals is reported; users described faster filtering and more skill-aware exploration than conventional recruitment sites.
- Generalizability is limited by the study setting: the evaluation uses computer-science-related posts from 51Job, and other industries or languages require additional framework construction and testing.
- Skill extraction is only partly automated. The classifier reports strong three-class accuracy, but key-phrase skill classification relies on trained assistants and expert review, and users raised concerns about proficiency standards.
- In the 26-participant user interviews, participants rated the system highly for exploration effectiveness, usability, and visual design/interactions, while task times averaged under 200 seconds. This supports the claim that the workflow is usable for the studied users, although it is not a controlled comparison with existing recruitment portals.
- The two case studies show how different applicants used the system: a graduating student explored frontend-related opportunities through skill similarity and salary, while a senior Android engineer balanced technical, leadership, salary, and welfare considerations.
- Participants particularly valued skill-centered exploration, including the ability to inspect post similarities and discover adjacent roles such as product manager alongside programming positions.
- The processing pipeline’s three-class sentence classifier reached 93.7% accuracy, giving practical support for large-scale skill extraction, while the later key-phrase-to-skill mapping still depended on manual and expert labeling.
- The evaluation also surfaced implementation and interpretation cautions: clustering efficiency may decline for very broad selections, and users wanted clearer standards for evaluating skill proficiency.
## Applications
This paper is most useful for:
- Computer-science job seekers comparing opportunities by skill alignment: The system is explicitly designed to help users inspect required skills, similar job posts, and detailed advertisements in a computer-science recruitment setting.
- University career advisors and student-support teams: The requirements analysis and evaluation emphasize helping applicants understand the job market and skill requirements as a whole, especially when users are uncertain which positions they are qualified for.
- Visualization and recruitment-interface researchers: The paper contributes a coordinated visual analytics workflow and a compact augmented radar-chart glyph for comparing skill structures and post distributions.
It is less suitable for:
- Immediate deployment in unrelated industries without adaptation: The evaluation uses computer-science-related posts, and the authors state that other fields require their own skill frameworks before applying the approach.
- Analyses that require selecting an extreme number of position types at once: The authors note that the Post Exploration View may suffer from reduced clustering efficiency and cluster quality in this setting, even though typical users select only a smaller set of position types.
## Limitations
- Visual scalability can degrade when users explore an extreme number of position types, because clustering efficiency and cluster quality may decline in the Post Exploration View.
- Generalizability is limited by the study setting: the evaluation uses computer-science-related posts from 51Job, and other industries or languages require additional framework construction and testing.
- Skill extraction is only partly automated. The classifier reports strong three-class accuracy, but key-phrase skill classification relies on trained assistants and expert review, and users raised concerns about proficiency standards.
- The user evidence is exploratory rather than comparative. Ratings, task completion, and interviews support usefulness, but the paper does not present a controlled experiment against existing recruitment websites.
- Salary representation is categorical because many job advertisements do not provide precise salary values, which limits fine-grained salary analysis.
## Frequently Asked Questions
What is the main idea of JobViz?
JobViz makes skills the central navigation structure for job advertisements. Instead of asking users to inspect long lists of filtered posts one by one, it shows skill requirements, job types, salary and company attributes, clusters of similar posts, and detailed advertisements in linked views.
How does the system turn raw advertisements into comparable skill information?
The pipeline filters job requirements, classifies requirement sentences into technical skills, foundational skills, or irrelevant information, extracts key phrases, maps them into a skill dictionary, and represents each job advertisement as a normalized skill vector.
What evidence does the paper provide?
The paper reports two case studies using 51Job advertisements and in-depth interviews with 26 target users. Participants completed five open-ended tasks, gave high Likert ratings, and provided qualitative feedback about the usefulness of skill-centered exploration.
What are the main limitations?
The evaluation focuses on computer-science-related posts from 51Job, so other industries and languages require new skill frameworks and further testing. The Post Exploration View may also face scalability issues when users select an extreme number of position types.
How should this paper be used or cited?
It is most appropriate to cite the paper as a visual analytics and system-design contribution for skill-driven exploration of job advertisements, including its workflow, skill extraction process, and augmented radar-chart glyph. It should not be treated as a general labor-market benchmark across all domains.
---
## RecruitScope: A Visual Analytics System for Multidimensional Recruitment Data Analysis
URL: https://www.qianhechen.com/publications/recruitscope/
RecruitScope is a visual analytics system for exploring multidimensional recruitment data, helping analysts compare hiring patterns across roles, skills, organizations, and candidate attributes.
[← Back to Publications](https://www.qianhechen.com/#publications)
Publication - 2025
# RecruitScope: A Visual Analytics System for Multidimensional Recruitment Data Analysis
Xiyuan Zhu, Wenhan Lyu, Chaochao Fu, Yilin Wang, Jie Zheng, Qiyue Tan, [Qianhe Chen](https://www.qianhechen.com/), Yixin Yu, and Ran Wang\*.
International Conference on Human-Engaged Computing (ICHEC 2025).

## Paper Information
Authors: Xiyuan Zhu, Wenhan Lyu, Chaochao Fu, Yilin Wang, Jie Zheng, Qiyue Tan, Qianhe Chen, Yixin Yu, Ran Wang
Venue: International Conference on Human-Engaged Computing (ICHEC 2025).
- Paper: [https://dl.acm.org/doi/10.1145/3786995.3787063](https://dl.acm.org/doi/10.1145/3786995.3787063)
- Arxiv: [https://arxiv.org/abs/2601.04630](https://arxiv.org/abs/2601.04630)
## Summary
RecruitScope is a visual analytics system for exploring online recruitment data across job, region, salary, education, experience, and industry. It responds to the limitation that many job platforms expose only narrow filtering or pairwise comparisons. The system prepares anonymized ChinaVis Challenge data through position filtering, requirement recoding, salary normalization, and IQR outlier removal, then presents eight coordinated views across job-level and industry-level analysis. Its distinctive design is a flower-shaped scatterplot that embeds multidimensional requirements into compact industry glyphs. The paper demonstrates use through two archetypal case studies that identify regional salary opportunities, industry growth signals, and a high-salary emerging position with moderate entry barriers.
## Why This Paper Matters
The paper addresses this question: How can a coordinated visual analytics system support multidimensional, cross-level exploration of recruitment data so job seekers and HR specialists can reason about salary patterns, industry dynamics, regional differences, and emerging positions?
It is especially relevant to:
- Exploring career options when salary, education, experience, region, and compensation type need to be considered together.
- Supporting HR specialists who want to compare market demand, adjust qualification thresholds, and identify possible talent shortages in emerging positions.
- Analyzing regional labor-market structure by combining job volume, salary intensity, industry preferences, and high-demand positions.
## Key Contributions
- RecruitScope frames recruitment analysis as a cross-level visual analytics problem, linking individual jobs, regional distributions, industries, and salaries so users can move beyond pairwise platform filters.
- The system integrates eight coordinated views across job-level and industry-level analysis, making it easier to compare qualification thresholds, compensation structures, geographic patterns, and industry demand within one workflow.
- The paper introduces a flower-shaped scatterplot that combines spatial positioning with compact glyph encoding, which matters for comparing many industries while still showing internal differences in education, experience, and salary requirements.
- The data-processing workflow maps heterogeneous recruitment records into comparable forms through position filtering, requirement encoding, annual salary normalization, and IQR-based outlier handling.
- Two case studies illustrate how the system can support job-seeker decisions and employer recruitment strategy by revealing regional salary opportunities, industry growth signals, and high-salary positions with moderate entry barriers.
## Method
1. Define the analysis problem and user groups: The paper positions recruitment analysis as a multidimensional problem that simple filters cannot address, then focuses on job seekers and employers, particularly HR specialists, as the main users.
2. Prepare anonymized recruitment data: The authors use anonymized ChinaVis Challenge recruitment records and filter a long-tailed position distribution to focus on the highest-volume positions.
3. Encode requirements and normalize salaries: Education and experience requirements are grouped into broader levels, salary formats are converted to annual values, and IQR-based outlier removal is applied within grouped records.
4. Construct job-level coordinated views: The Job-level View combines linked displays for qualification thresholds, regional distribution, job comparison, compensation structure, and requirement-salary distributions.
5. Construct industry-level and regional views: The Industry-level View supports macro comparisons across industries and regions, including the flower-shaped glyph design and a regional profile view that combines salary, job, and industry information.
6. Demonstrate use through archetypal cases: Two case studies walk through how the system reveals salary opportunities, regional effects, and emerging-position signals for a job seeker and an employer.
## Evaluation and Findings
The evaluation uses 2024 ChinaVis Challenge anonymized recruitment data.
The two cases reveal regional salary distribution patterns, industry evolution trends, and high-demand emerging roles in the job market.
The evaluation is primarily qualitative, so the findings should be read with these caveats in mind:
- The paper does not report a controlled baseline, so the comparison should be read as qualitative and exploratory.
- No numerical improvement is reported; the contribution is demonstrated through broader exploratory coverage and decision-support scenarios.
- The evaluation is illustrative rather than controlled, because the paper reports two archetypal case studies and no quantitative usability comparison.
- The main evaluation is qualitative: two case studies show that RecruitScope can reveal regional salary distribution patterns, characterize industry growth trajectories, and discover emerging roles, but the paper does not report measured task performance.
- In the job-seeker case, the GP-EdD qualification pairing appears to have substantial demand, and the selected position shows annual salaries of 50,000 to 160,000 CNY in particular industries and regions.
- The regional analysis changes the job seeker's decision process by highlighting Prov-K and Prov-F as higher-salary targets, rather than relying only on top-tier city assumptions.
- In the employer case, Pos-eb45-2371-1beb-76f6 is interpreted as a talent-gap signal: it has medium education and low experience requirements but annual salaries of 80,000 to 150,000 CNY, higher than comparable positions.
- The flower-shaped scatterplot is presented as a way to reduce clutter in large-scale industry comparison while preserving both relative market position and internal requirement composition.
## Applications
This paper is most useful for:
- Job seekers comparing career options across qualification, region, salary, and compensation structure: The system explicitly supports analysis of job positions and salary patterns and the first case study shows how regional and industry views can reshape a job seeker's choices.
- Employers and HR specialists planning recruitment strategy: The paper targets HR specialists and demonstrates how a company can interpret high-salary, moderate-threshold positions as talent-gap signals and adjust recruitment plans.
- Labor-market analysts studying regional and industry patterns in online vacancies: RecruitScope connects industry-level, regional, occupational, and salary information, making it useful for exploratory analysis of market structure.
It is less suitable for:
- Teams that need validated transfer across many recruitment platforms or data schemas: The authors state that generalization across datasets with different structures still needs validation.
- Users who need compact automatic summaries instead of cross-view exploration: The paper notes that RecruitScope lacks compact summarization and that nonlinear relationships may require reasoning across multiple views.
## Limitations
- Generalization to recruitment datasets with different structures or sources remains unvalidated.
- The system lacks compact summarization; some nonlinear relationships among education, experience, and salary require cross-view reasoning.
- The evaluation is illustrative rather than controlled, because the paper reports two archetypal case studies and no quantitative usability comparison.
- Filtering to the top 1% of positions stabilizes analysis around high-volume roles but may leave some long-tail or rare-position signals outside the demonstrated workflow.
- The authors identify learning curve and usability as areas for further improvement.
## Frequently Asked Questions
What is RecruitScope's main idea?
RecruitScope is a coordinated visual analytics system for recruitment data. It helps users move between job-level details and industry-level patterns while comparing qualifications, salary, geography, and compensation structure.
What makes the visualization design distinctive?
The paper's most distinctive design is the flower-shaped scatterplot. Each industry is represented as a compact glyph whose petals encode education, experience, salary, and missing values, while its position shows the industry's relationship to high-education and high-experience demand.
What evidence does the paper provide?
The paper demonstrates the system with two archetypal case studies using anonymized ChinaVis Challenge recruitment data. The cases show how a job seeker and an employer can discover salary, regional, industry, and emerging-position patterns.
What are the main limitations?
The authors note that generalization to recruitment datasets with different structures still needs validation. They also state that RecruitScope lacks compact summarization, so some nonlinear salary and qualification relationships require cross-view reasoning.
How should this paper be used or cited?
It is most appropriate to cite the work as a visual analytics system for multidimensional recruitment data and as a design example for glyph-based, cross-level labor-market exploration.
---
## RumorLens: Interactive Analysis and Validation of Suspected Rumors on Social Media
URL: https://www.qianhechen.com/publications/rumorlens/
RumorLens supports interactive analysis and validation of suspected rumors on social media through visual analytics.
[← Back to Publications](https://www.qianhechen.com/#publications)
Publication - 2022
# RumorLens: Interactive Analysis and Validation of Suspected Rumors on Social Media
Ran Wang, Kehan Du, [Qianhe Chen](https://www.qianhechen.com/), Yifei Zhao, Mojie Tang, Hongxi Tao, Shipan Wang, Yiyao Li, and [Yong Wang](https://yong-wang.org/index.html)\*.
CHI EA '22: CHI Conference on Human Factors in Computing Systems Extended Abstracts.

## Paper Information
Authors: Ran Wang, Kehan Du, Qianhe Chen, Yifei Zhao, Mojie Tang, Hongxi Tao, Shipan Wang, Yiyao Li, Yong Wang
Venue: CHI EA '22: CHI Conference on Human Factors in Computing Systems Extended Abstracts.
- Paper: [https://doi.org/10.1145/3491101.3519712](https://doi.org/10.1145/3491101.3519712)
- Arxiv: [https://arxiv.org/abs/2203.03098](https://arxiv.org/abs/2203.03098)
- Project: [https://rumorlens.datavizu.app/](https://rumorlens.datavizu.app/)
- GitHub: [https://github.com/DataVizU/RumorLens](https://github.com/DataVizU/RumorLens)
## Summary
RumorLens is an interactive visual analytics system for administrators who must inspect large queues of suspected rumors on social media. Built from four months of requirements work with platform administrators, it combines NLP-style preprocessing with coordinated views for spatial-temporal overview, feature projection, and detailed propagation analysis. Its distinctive contribution is a circular propagation view that displays retweet hierarchy, time, sentiment, keywords, and post details in a compact layout. The evaluation uses a real Sina Weibo dataset and a domain-expert case study, showing how the tool can guide a reasoned rumor judgment while leaving quantitative performance and broader deployment questions open.
## Why This Paper Matters
The paper addresses this question: How can social media platform administrators combine automated feature extraction with interactive visualization to analyze and validate large sets of suspected rumors while understanding their spatial, temporal, feature, and propagation patterns?
It is especially relevant to:
- Social media moderation teams that need to inspect queues of suspected rumors produced by user reports, crowdsourcing, or automated detectors.
- Visual analytics research on misinformation workflows, especially studies concerned with coordinated multiple views and explainable human-computer decision support.
- Social-media analysis projects that need to examine content, user, topic, and propagation features in one exploratory workflow.
## Key Contributions
- RumorLens offers a requirements-grounded visual analytics workflow for suspected rumor review. This matters because the paper positions rumor validation as a task where human judgment and computational support need to work together rather than as a purely automatic classification problem.
- The system organizes rumor analysis across three coordinated levels: spatial-temporal overview, feature-based projection, and detailed propagation. This structure helps analysts move from broad filtering to case-level reasoning without losing the context of the larger collection.
- The paper introduces a compact circular propagation design for retweet diffusion. Its value is that hierarchy, time, sentiment, keywords, and post details can be inspected together, supporting validation decisions that depend on how a message spreads.
- The authors demonstrate the system with a real Sina Weibo dataset and a domain expert case study. This gives the design ecological grounding, while also making clear that the evaluation is exploratory rather than a quantitative benchmark.
## Method
1. Derive workflow requirements with platform administrators: The authors worked with three administrators over four months and distilled the task into three needs: exploring space-time distributions, comparing suspected rumor characteristics, and inspecting propagation details.
2. Collect and prepare a real suspected-rumor dataset: RumorLens is demonstrated on Sina Weibo data containing suspected rumors, retweets, comments, and user profiles collected over roughly one year.
3. Extract textual, topical, influence, and projection features: The system enriches raw posts using TF-IDF, sentiment recognition, topic classification, influence calculation, and t-SNE projection so suspected rumors can be compared visually.
4. Support overview-level filtering: A choropleth map and temporal topic chart let administrators narrow the collection by location, topic, and time before examining detailed cases.
5. Represent cases in a feature projection: The projection view places suspected rumors in a two-dimensional feature map and uses glyphs to encode topic, influence, user fan and followee counts, tweet count, and profile integrity.
6. Inspect propagation and post details interactively: The propagation view uses a circular layout to show original tweets and multi-level retweets by hierarchy and date, with interactions for user information, full content, and side-by-side comparison.
## Evaluation and Findings
The evaluation uses Sina Weibo suspected-rumor dataset.
The expert used the overview, projection, and propagation views to select a world-news case, inspect suspicious account and propagation cues, and conclude that the tweet was probably a rumor.
The evaluation is primarily qualitative, so the findings should be read with these caveats in mind:
- The paper does not report a controlled baseline; the result should be interpreted as qualitative evidence from one experienced administrator.
- The study supports the usefulness of the workflow for case reasoning, but it does not measure speed, accuracy, or comparative benefit.
- The evaluation is based on one domain-expert case study and does not provide controlled comparisons, task-time measurements, or validation-accuracy metrics.
- The dataset and evaluation are limited to Chinese-language Sina Weibo data, so cross-platform and multilingual generalization are not established.
- In the case study, an experienced administrator used RumorLens to progress from broad filtering to instance validation and concluded that a selected tweet was probably a rumor. This supports the system as a qualitative decision aid, but it does not establish measured accuracy or time savings.
- The workflow surfaced interpretable cues that mattered to the expert: high influence despite an unauthenticated account and relatively few fans, unusually deep retweet propagation, strong sentiment signals, and comments suggesting the original tweet was misleading.
- The circular propagation design is argued to better combine retweet hierarchy and time-series information than alternatives such as node-link diagrams, treemaps, spiral timelines, or sunburst charts, especially when compactness is important.
- The requirements study shows that administrators wanted tools for prioritizing suspected rumors, comparing feature patterns, and inspecting propagation paths and post contents. RumorLens directly maps its main views to those three needs.
- The paper’s conclusions should be read within its scope: the evaluation uses one expert case study, the dataset comes from Chinese-language Sina Weibo, and the approach focuses mainly on textual information rather than images or videos.
## Applications
This paper is most useful for:
- Social media platform administrators and content-moderation analysts who already receive suspected-rumor candidates: The system is designed to help administrators analyze and validate suspected rumors through overview filtering, feature comparison, and propagation inspection.
- Visualization and HCI researchers studying misinformation analysis workflows: The paper contributes a coordinated visual analytics system and a new circular propagation design for inspecting information diffusion.
- Researchers working with Chinese microblog data or Sina Weibo-style rumor datasets: The dataset and evaluation are explicitly grounded in Sina Weibo suspected-rumor data.
It is less suitable for:
- Projects that require a deployable automatic rumor classifier with reported accuracy, precision, or recall: The paper centers on interactive validation and reports a case study, not a classifier benchmark.
- Deployments that must already be validated across languages and social platforms: RumorLens is designed for and evaluated on Chinese-language Sina Weibo data, with other languages left for future work.
## Limitations
- The evaluation is based on one domain-expert case study and does not provide controlled comparisons, task-time measurements, or validation-accuracy metrics.
- The system needs richer user-history information, such as historical complaints and prior identified rumors connected to an account.
- The paper leaves open how to choose rumor features and evaluate their effects on validation decisions.
- The dataset and evaluation are limited to Chinese-language Sina Weibo data, so cross-platform and multilingual generalization are not established.
- The approach focuses mainly on text and does not incorporate image information from rumor messages.
## Frequently Asked Questions
What is the main idea of RumorLens?
RumorLens is an interactive visual analytics system for suspected rumors on social media. It lets administrators start with spatial and temporal overviews, compare suspected rumors through feature glyphs, and then inspect the detailed propagation of an individual message.
What problem does the paper try to solve?
The paper targets the gap between slow manual review and imperfect automatic rumor detection. It argues that platform administrators need tools that preserve human judgment while helping them handle many suspected rumors and inspect why a case may be suspicious.
How does the system support rumor validation?
It combines preprocessing methods such as keyword extraction, sentiment recognition, topic classification, influence calculation, and t-SNE projection with coordinated visual views. The most detailed view shows retweet depth, timing, sentiment, keywords, and post details for a selected suspected rumor.
What evidence does the paper provide?
The authors report four months of requirements work with platform administrators, a real Sina Weibo dataset, and one case study with an experienced domain expert. The case study illustrates how the system can guide a validation process, but it is not a controlled comparison.
What are the main limitations?
The paper does not report quantitative task performance or classifier accuracy for RumorLens. It is evaluated on Chinese-language Sina Weibo data, uses one expert case study, and leaves richer user-history features, feature-effect evaluation, multilingual validation, and image-based rumor evidence for future work.